In technical analysis, candlestick patterns are vital clues to future market movements. One of the most significant among them is the doji candle. Recognized for its distinct appearance and ability to signal potential turning points in price trends, the doji candle is a tool every trader should understand.
This article explains what a doji candle is, how to interpret it in different market contexts, the variations of doji patterns, and how to use them effectively in your trading strategy.
Table of Contents
What Is a Doji Candle?
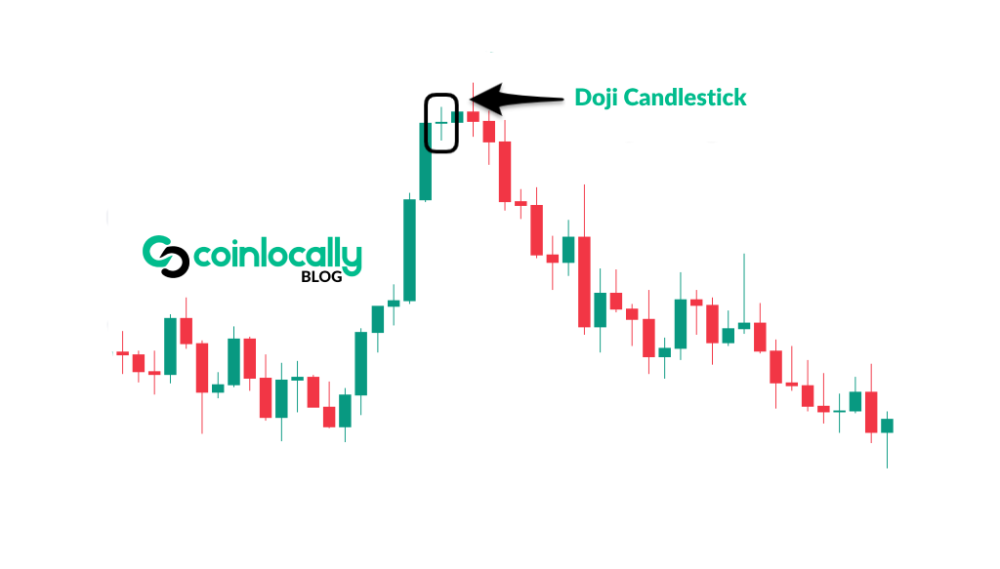
A doji candle is a candlestick pattern that forms when an asset’s opening and closing prices are virtually the same or very close within a specific period. As a result, the candle’s body is tiny, sometimes appearing as just a thin line. This indicates indecision in the market between buyers and sellers.
The wicks or shadows of a doji candle can vary in length. Depending on their position, the candle can provide insight into market sentiment and possible future price action. When buyers and sellers reach a stalemate, the market often pauses, and this pause is visually represented by a doji.

Why the Doji Candle Matters
The doji candle is critical in signaling possible trend reversals or continuations. Its importance lies in its reflection of market indecision. When a doji appears after a prolonged trend, it often implies that the momentum may be weakening. This gives traders a chance to prepare for a shift in direction or to confirm the current trend’s strength.
While a single doji should not be used in isolation, it becomes more powerful when analyzed with other candlesticks and technical indicators.
Types of Doji Candles
The doji candle has several variations, each with slightly different implications depending on its shape and position within a chart.
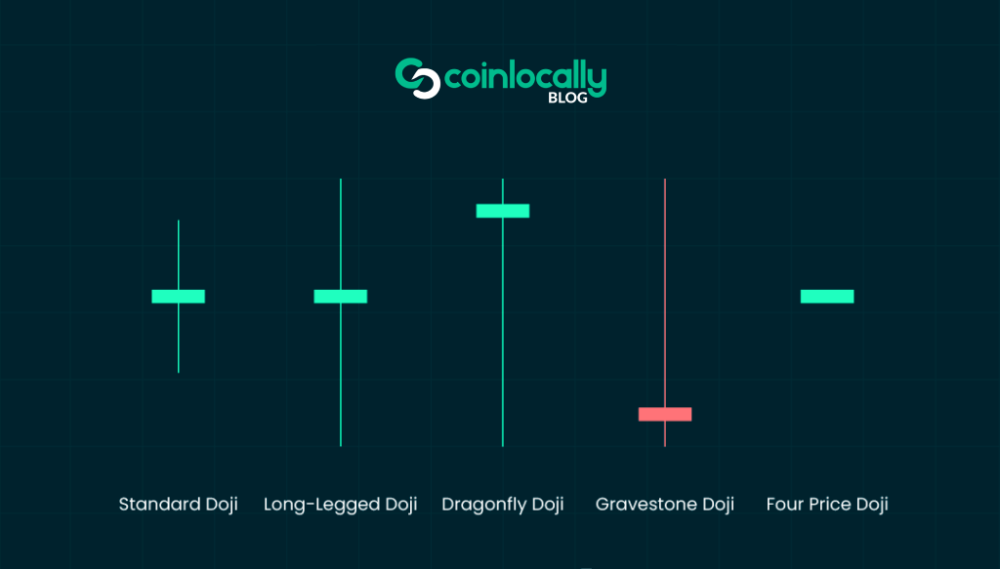
Standard Doji
This is the classic version, in which the candle has equal upper and lower shadows and is nearly identical in open and close. It often appears during market consolidation and indicates a temporary balance between bullish and bearish pressure.
Long-Legged Doji
This version has long upper and lower shadows, showing that prices moved significantly in both directions during the session but ultimately closed near the opening price. It highlights market volatility and a heightened level of uncertainty.
Dragonfly Doji
This pattern has a long lower shadow and little to no upper shadow. It suggests sellers drove the price down early in the session, but buyers regained control and pushed it back to the opening level. When this pattern appears after a downtrend, it can indicate a bullish reversal.
Gravestone Doji
The opposite of the dragonfly, this candle has a long upper shadow and almost no lower shadow. It shows buyers drove prices higher, but sellers overwhelmed them and pushed prices back down. Found after an uptrend, it may point to a bearish reversal.

Interpreting the Doji Candle in Market Context
A key aspect of using the doji candle effectively is understanding its context. It does not provide direction but signals that a potential change is brewing.
When a doji candle appears after a long uptrend, it can suggest that buying momentum is weakening, and a bearish reversal might be approaching. If it forms after a sustained downtrend, it might indicate seller exhaustion and an opportunity for bulls to take control.
Paying attention to where the doji forms on a chart is essential. The signal becomes more meaningful if it appears near key support or resistance levels. Volume can also play a role; a doji formed on high volume may suggest a more substantial potential reversal than one formed on low volume.
How to Trade Using the Doji Candle
Trading with the doji candle involves patience and confirmation. Here are a few ways to incorporate it into your strategy.
Wait for Confirmation
Since a doji represents indecision, traders should wait for the next candle to confirm the market’s direction. For example, a bullish candle following a doji after a downtrend can strongly indicate a reversal. Similarly, a bearish candle after a doji in an uptrend can confirm a bearish shift.
Use with Other Indicators
Combine doji candle signals with technical indicators such as the Relative Strength Index (RSI), Moving Averages, or MACD to improve their reliability. These tools can help confirm overbought or oversold conditions, clarifying the doji’s message.
Apply Risk Management
It’s crucial to manage risk whenever you trade based on candlestick patterns. Place stop-loss orders below the low of the doji if you’re going long, or above the high if you’re going short. This protects you in case the signal turns out to be false.
Recognize Market Conditions
The doji candle’s effectiveness depends on the market you’re in. In trending markets, a doji often signals a pause or potential reversal. In ranging or sideways markets, it may reflect continued indecision and is less likely to lead to a strong move.
Limitations
While the doji candle is a valuable part of a trader’s toolkit, it does have limitations. One of the most common pitfalls is assuming that any doji automatically signals a reversal. In reality, many doji patterns are followed by continuation rather than reversal.
Another limitation is that the pattern must be viewed in the broader context. A trader risks making premature decisions without considering trend direction, volume, and other signals. Also, doji candles may appear more frequently in low-volume or highly manipulated markets but offer less reliability.
Final Thoughts
The doji candle is a powerful symbol of market hesitation. It tells traders that neither bulls nor bears were able to dominate during a specific trading period, creating a moment of equilibrium. This moment often precedes a breakout or reversal and can be used to anticipate future price movement, if confirmed by additional analysis.
Understanding the different types of doji candles and how to interpret them can provide you with a valuable edge. While they should not be used alone, when incorporated into a broader strategy that includes confirmation, technical indicators, and risk management, doji candles can become reliable signals for smart trading decisions.
Whether you’re trading cryptocurrencies, stocks, or forex, learning to read and apply the doji candle pattern is a step toward more informed and disciplined trading.


