Understanding chart patterns is a fundamental skill in technical analysis, helping traders anticipate potential price movements. Among the most recognized and reliable patterns is the cup and handle formation. This bullish continuation pattern typically appears after an uptrend and signals the potential for that trend to continue with renewed strength. Popularized by legendary trader William O’Neil in his 1988 book How to Make Money in Stocks, the cup and handle is a time-tested pattern to spot buying opportunities.
Table of Contents
Understanding the Cup and Handle Pattern
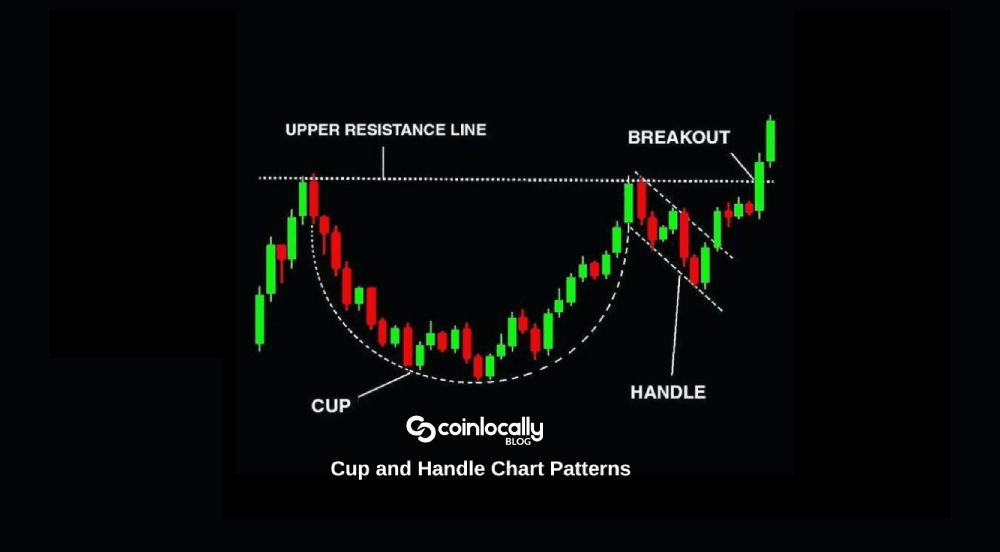
The cup and handle pattern gets its name from its visual resemblance to a teacup: a rounded bottom forms the “cup,” followed by a short pullback or consolidation period forms the “handle.” This pattern is considered a bullish continuation pattern. It suggests a temporary pause in an asset’s upward momentum before it continues its previous trajectory. The formation takes time to set up, contributing to its reliability.
The pattern is often found on daily or weekly charts but can appear on shorter timeframes. It is especially common in markets like stocks, cryptocurrencies, and forex. The cup and handle signals a strong opportunity to go long on an asset.
Anatomy of the Cup and Handle Pattern
Identifying the cup and handle pattern accurately requires understanding its components.
The Cup
The “cup” is the first part of the pattern and usually takes shape over several weeks or months, typically ranging from one to six months. Sources suggest the cup formation can be as short as seven weeks or as long as 65 weeks. It resembles a “U” shape, reflecting a slow and steady decline followed by a gradual recovery. A round bottom, rather than a sharp “V,” is crucial as it indicates stabilization and a gradual shift from selling to buying pressure. Some sources suggest an ideal cup depth between 38.2% and 61.8% of the previous uptrend, or between 10-30% of the pattern’s height for better reliability.
During the cup formation, volume typically decreases during the decline phase and starts to pick up again as the price climbs back to previous highs. Key characteristics of the cup include heavy volume on the left side, light volume in the middle, and increasing volume on the right side. This volume pattern shows that selling pressure is fading, and buyers are regaining control.
The Handle
After the price approaches the prior high or resistance level (often called the “creek”), it pulls back slightly, creating the “handle”. This is a period of consolidation that usually moves sideways or slightly downward. The handle typically lasts from a few days to weeks, often cited as one to four weeks.
The handle is considered the most essential part of the pattern, acting as the catalyst for the potential breakout. A strong handle has specific characteristics: on a 5-minute timeframe, it might be made of 4 to 10 candlesticks; the candles should have small bodies in a tight range; and the breakout should produce significant volume and price expansion.
Significantly, the handle should not exceed one-third of the cup’s depth. If it dips too far, it may invalidate the pattern. Ideally, the handle should form in the top half of the cup pattern and stay above the 50% Fibonacci retracement level of the cup’s depth. The handle’s slight downward slope of 10-15% suggests proper consolidation. This handle phase reflects short-term profit-taking before a potential breakout and can shake out weak hands.
The Breakout
The pattern confirms when the price breaks above the resistance level formed at the top of the cup and handle. Ideally, this move is accompanied by a spike in volume, confirming strong buying interest. A breakout candle needs to close above the resistance line of the handle. Once the breakout is established, it can lead to significant upward price movement. The breakout after a strong handle often occurs in the morning after a gap up or in the late afternoon, typically characterized by substantial volume after a quiet period.
Key Rules for Identifying the Cup and Handle Pattern
Several criteria are essential to confirm the validity of a cup and handle pattern.
- Prior Uptrend: The pattern must form after an established bullish trend.
- Cup Shape: The cup should have a rounded “U” shape, not a sharp “V”.
- Cup Depth: Avoid overly deep cups. A shallow, rounded bottom is preferred.
- Handle Shape and Position: The handle should slope slightly downward or move sideways, not upward. It must form in the top half of the cup and should not exceed one-third of the cup’s depth. Handles staying above the 50% Fibonacci retracement level are more reliable.
- Handle Duration: The handle should be shorter than the cup’s duration.
- Volume Trends: Volume should decrease during the cup’s decline and increase as the price recovers. Volume should decrease during handle formation.
- Breakout Confirmation: The pattern is confirmed when the price breaks above the resistance level (top of the cup). This breakout should occur with substantial or increased volume.
Ignoring volume is a common mistake. If the breakout happens on low volume, the move might not stick. Forcing the pattern, or trading something that only “kind of” looks like a cup and handle, is also a mistake that can lead to poor results.
Trading Strategies for the Cup and Handle Pattern
Trading the cup and handle pattern effectively involves carefully planning your entry and exit points.
The most basic strategy is to look for entering an extended position. Wait for the handle to form and the price to break above the resistance level (top of the handle). This resistance line is usually drawn at the highest point of the handle before the breakout.
Entry Strategies
There are two main entry strategies:
- Breakout Entry Strategy: This is a more conservative approach. You wait for a confirmed breakout above the handle’s resistance line. Enter the trade when the price breaks above this line, ideally with increased volume. You can use a buy stop order placed slightly above the upper trendline of the handle to automatically catch the breakout. Waiting for a daily close above the resistance, especially with above-average volume, is recommended.
- Early Entry Strategy: Aggressive traders might enter during the handle’s formation to potentially get a lower entry price. This strategy carries a higher risk of a false breakout since the pattern isn’t fully confirmed. If using this approach, watch for consolidation with declining volume and enter as buying volume rises.
Some traders combine these approaches, entering a small position early and adding more at the confirmed breakout to balance risk and reward.
Setting Stop-Loss Orders
Setting a stop-loss order is crucial for managing risk and protecting against potential false breakouts. The most common placement for a stop-loss when trading a cup and handle is slightly below the lowest point of the handle. This placement helps you exit quickly if the breakout fails.
Alternatively, some traders with higher risk tolerance might place the stop-loss below the cup depending on market volatility. Proper position sizing, considering your risk tolerance and account size, is also essential. Oversizing can lead to significant losses if the trade goes against you.
Setting Profit Targets for the Cup and Handle Pattern
A common way to set a profit target for the cup and handle pattern is to measure the vertical distance from the bottom of the cup to the resistance level (the top of the cup) and add that distance to the breakout point above the handle. For example, if the cup’s depth is 20 points and the breakout occurs at 100, the target would be 120. This projection provides a realistic estimate of the potential upward movement.
Some sources propose alternative ways to set targets, suggesting that simply applying the depth of the cup to every pattern might not be the most effective approach in today’s markets. One alternative strategy discussed involves selling at the chart’s supply line or upper resistance line, using technical levels directly in front of you rather than a universal profit target system.
The cup and handle pattern often offers an attractive risk-to-reward ratio, cited as 2.5 to 1. This means potential profits are significantly greater than potential losses. Even with a baseline success rate of around 49% (which increases considerably over longer timeframes), this ratio can lead to consistent gains over time.
The arithmetic and logarithmic target calculations are used. For precious metals like gold, the arithmetic approach measures the depth of the cup and projects it upward. The logarithmic approach measures the percentage of movement from the cup bottom to the previous high. It projects the same percentage forward from the breakout point, often yielding higher targets in bull markets. Gold’s 13-year cup and handle pattern that broke out in March 2024 suggested arithmetic targets around $3,000/oz (achieved) and logarithmic targets approaching $4,000/oz.
Using Technical Indicators to Confirm the Pattern
Combining the cup and handle pattern with other technical indicators can significantly enhance trading accuracy and help confirm the pattern’s validity. Relying solely on the pattern can be risky.
Volume Indicators
As mentioned, volume confirmation is critical. Look for specific volume behavior: high on the left cup, low in the middle, increasing on the right cup, lower during the handle, and a significant spike at the breakout. Volume indicators like Volume Moving Averages and On-Balance Volume (OBV) can help validate the pattern and breakout strength.
Moving Averages
Use the Simple Moving Average (SMA) or Exponential Moving Average (EMA) to confirm the overall trend direction. Ideally, the price should be above key moving averages (like the 50-day or 200-day) before and during the pattern formation, indicating underlying bullish momentum.
Momentum Indicators
Indicators such as the Relative Strength Index (RSI) and Moving Average Convergence Divergence (MACD) help gauge the strength of a move and identify potential overbought or oversold conditions. Before the breakout, check the RSI; ideally, it should be below 70, suggesting potential for further gains. MACD can confirm momentum shifts with a bullish crossover.
Bollinger Bands
Bollinger Bands can measure volatility. The price might touch the lower band during the cup, suggesting it was oversold. As the handle forms, the price moves towards the middle or upper band, and a breakout above the upper band confirms the strength of the upward movement.
Fibonacci Retracement Levels
Fibonacci retracement levels are crucial for confirming the handle’s validity. Handles that remain above the 38.2% or 50% Fibonacci level are more likely to result in successful breakouts.
Ichimoku Cloud
One strategy involves buying the cup and handling the breakout when the candlestick closes above the Ichimoku cloud. A convincing close above the cloud is additional confirmation of trend strength. However, it may indicate weakness if the stock struggles to close above the cloud or uses significant effort.
When using multiple indicators, avoid indicator redundancy. Choose indicators that measure different aspects (trend, momentum, volume) for a more comprehensive view.
Regarding the Bearish Harami keyword, this is a two-candlestick pattern typically signaling a bearish reversal. The provided sources do not contain information about the Bearish Harami pattern or how it relates to the cup and handle.
Limitations of the Cup and Handle Pattern
Like all technical patterns, the cup and handle pattern isn’t always accurate and has limitations traders should consider.
- False Breakouts can occur, especially in choppy or news-driven markets. This is a significant risk, highlighting the importance of waiting for confirmation and using stop-loss orders.
- Subjectivity: Identifying the pattern can sometimes be subjective, leading to inconsistent interpretations. Not every rounded bottom and subsequent pullback is a proper cup and handle.
- Time to Form: The pattern can take significant time to fully form (weeks, months, or even years). This can lead to late decisions or cause traders to miss other waiting opportunities.
- Market Conditions: The pattern may not perform well in volatile or bearish market conditions. It generally works best when it aligns with the broader market trend.
- Illiquid Stocks: The pattern can be unreliable in illiquid stocks.
- Fundamental Factors: The pattern does not consider macroeconomic or fundamental factors, which can heavily influence price direction.
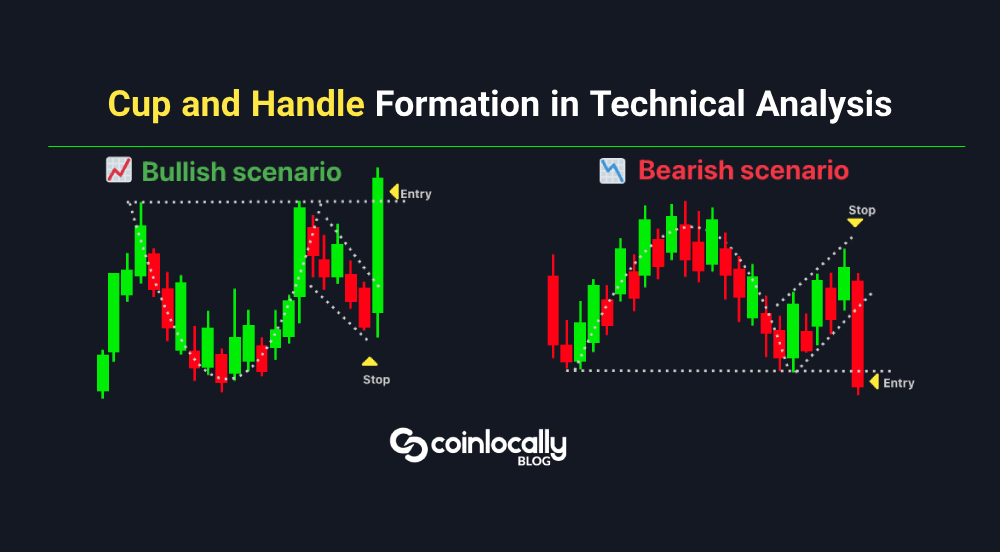
The Inverted Cup and Handle Pattern
The inverted cup and handle pattern is the opposite of the traditional one. A bearish pattern typically appears during up- or downtrends and signals a potential downward price movement.
Identifying the Inverted Pattern
The inverted cup and handle pattern consists of two main parts:
- The Inverted Cup is an inverted U-shape where the price gradually rises, consolidates (forms a rounded top), and then declines. The rounded top, not a sharp V-shape, is essential here as it indicates a gradual reversal from bullish to bearish sentiment. Volume typically decreases during the cup formation and increases as prices decline.
- The Handle: Prices usually experience a minor upward retracement or consolidation after the inverted cup forms. This upward handle is relatively short in duration compared to the cup. It often appears as a small flag or pennant. The handle should ideally not exceed half of the cup’s depth. Volume typically increases during the handle formation.
The pattern confirms with a breakdown below the neckline, which is the lowest point reached before the handle formed. A decisive close below the neckline, ideally with a strong candlestick and minimal wicks, indicates a reliable breakdown. A substantial increase in volume during the neckline break further validates the pattern and minimizes the risk of false signals.
Trading the Inverted Pattern
Trading the inverted cup and handle pattern is similar to the regular pattern, but in reverse. It presents opportunities to enter a short position.
- Entry Points: Traders can enter either on the break of the handle’s upper boundary (more aggressive, aiming to catch the downward move out of the handle) or after the neckline break (more conservative, waiting for a breakout).
- Stop-Loss: Place the stop-loss order slightly above the highest point of the handle to protect against upward spikes.
- Profit Target: Measure the vertical distance from the top of the inverted cup to the neckline, and project this distance downward from the breakdown point. This provides an estimate of the potential downward movement.
Like the bullish version, the inverted pattern has advantages like providing clear signals and aiding risk management, but disadvantages like complex identification, rarity, and susceptibility to false breakouts. Ignoring volume, incorrect pattern identification, and overlooking market conditions are common mistakes to avoid.
Performance and Reliability
The cup and handle pattern has a respectable track record, particularly over longer timeframes. Historical analysis reveals a baseline success rate of 49%. However, this rate improves significantly over extended periods: 70% for 1 year, 80% for 5 years, and 85% for 10 years. These figures offer a general perspective, but results can vary depending on market conditions and asset types.
A study of 391 cup and handle formations across 500 stocks between 1991 and 1996 indicated a 26% failure rate, which reduced to 10% by waiting for a confirmed upside breakout. Successful formations saw an average price increase of 38%, with most gains between 10% and 20%.
The pattern performs differently under varying market conditions. Bull markets tend to be more favorable, while bear markets can significantly affect their reliability. It is applicable across different markets, including stocks, forex, crypto, commodities, and futures. The pattern works particularly well when it aligns with broader market trends and shows substantial volume during breakouts.
Historical examples include major breakouts in the S&P 500 (1937-1950), Gold (1996-2005, 2011-2024), Japanese Nikkei (1960s-1970s), and Hong Kong Hang Seng (1973-1986), demonstrating the pattern’s reliability and potential magnitude. Gold’s 13-year cup and handle pattern breaking out in March 2024 was particularly significant due to its duration, textbook quality, and the breakout occurring at new all-time highs.
While silver’s 45-year base dating back to 1980 isn’t technically a cup and handle (due to excessive retracement), its extended consolidation near key resistance ($50/oz) represents an extraordinarily bullish setup with potentially explosive upside once broken.
Avoiding Costly Mistakes in Cup and Handle Trading
Even experienced traders can make mistakes when trading this pattern. Being aware of common pitfalls helps protect capital and increase success.
- Premature Entry: Entering before the handle completes or the pattern fully forms exposes you to the risk of a false breakout. Patience is key; wait for the pattern to develop completely and a confirmed breakout to occur.
- Ignoring Volume: As highlighted earlier, volume confirmation is crucial. A breakout on low volume is less likely to succeed.
- Misidentifying Patterns: Not every price movement resembling a cup and handle is a genuine formation. Develop a keen eye for the key features and avoid trading setups that are too steep, lopsided, or chaotic.
- Ignoring Market Context: The broader market and sector trends significantly impact the pattern’s success. Always consider the overall market health.
- Oversizing: Using excessive capital on a single trade based on the pattern is a common mistake that can magnify losses. Use position sizing that keeps your drawdown safe.
- Navigating Psychological Challenges: Trading the cup and handle requires patience, discipline, and emotional control. Avoid impulsive choices driven by frustration or excitement.
Effective risk management, including stop-loss orders and proper position sizing, is essential for long-term success with this pattern.
Finding Cup and Handle Patterns (Stock Screener)
Identifying potential cup and handle patterns involves manually scanning charts or using technical analysis tools. While the sources discuss tools like LuxAlgo and TradingView for analyzing patterns and volume, they do not provide specific information on using a “stock screener” to automatically find cup and handle formations across many securities. Such screeners typically require particular criteria (like cup depth, handle length, volume patterns) to filter stocks, a functionality often built into advanced trading platforms or charting software.
Conclusion
The cup and handle pattern is a robust and reliable bullish continuation pattern in technical analysis. Understanding its anatomy—the rounded cup, the relatively shallow handle, and the volume characteristics—is crucial for accurate identification. Adhering to the pattern’s key rules regarding shape, depth, duration, and volume confirmation enhances its reliability.
Trading strategies center around identifying opportune entry points, most commonly waiting for a volume-confirmed breakout above the handle’s resistance. Setting realistic profit targets, often based on the cup’s depth, and implementing disciplined risk management through stop-loss orders below the handle are vital components of a robust trading plan.
Combining the cup and handle with other technical indicators, such as volume analysis, moving averages, momentum indicators, and Fibonacci levels, can significantly boost trading accuracy and confidence by providing confluence and filtering out false signals.
While generally reliable, traders must be aware of the pattern’s limitations, including the potential for false breakouts, subjective identification, and performance variations based on market conditions. The inverted cup and handle pattern offers a bearish counterpart, signaling potential downward moves and traded using similar principles in reverse.
Ultimately, success with the cup and handle pattern depends on correct identification, proper risk management, patience, and confirmation through volume and supporting indicators. You can effectively integrate this powerful tool into your trading approach by learning to spot the pattern, planning your trades, and adhering to risk control.