A bullish pennant is a technical trading pattern that indicates the impending continuation of a strong upward price move. They are formed when a market makes an extensive move higher, then pauses and consolidates between converging support and resistance lines. Technical traders interpret this as a sign that the original ascending price move will likely resume. This makes the bullish pennant pattern particularly sought after, as it can offer an early indication of significant upward price action. It is considered a reliable continuation pattern in technical analysis.
The pattern is a continuation pattern found in the price charts of financially traded assets. It is characterized by a clear direction of the price trend, followed by a consolidation and rangebound movement, which is then followed by a resumption of the trend. It forms when asset prices rally or fall sharply. A pennant is a continuation pattern formed after a significant price movement. It is considered a short-term consolidation pattern showing a brief pause in the existing trend before the price resumes its previous direction.
Table of Contents
Components of a Bullish Pennant Pattern
The key components of a bullish pennant pattern include:
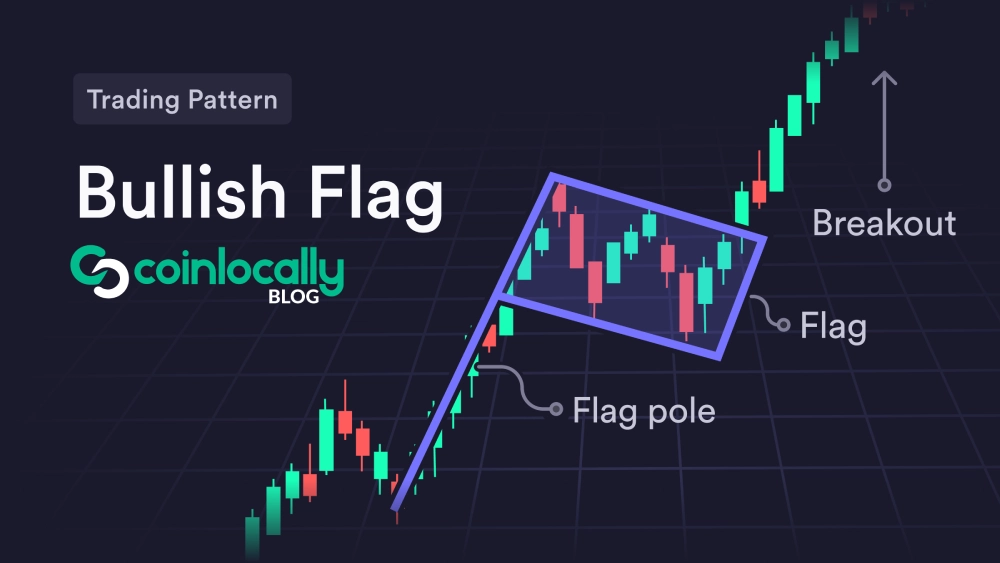
An Uptrend (Flagpole)
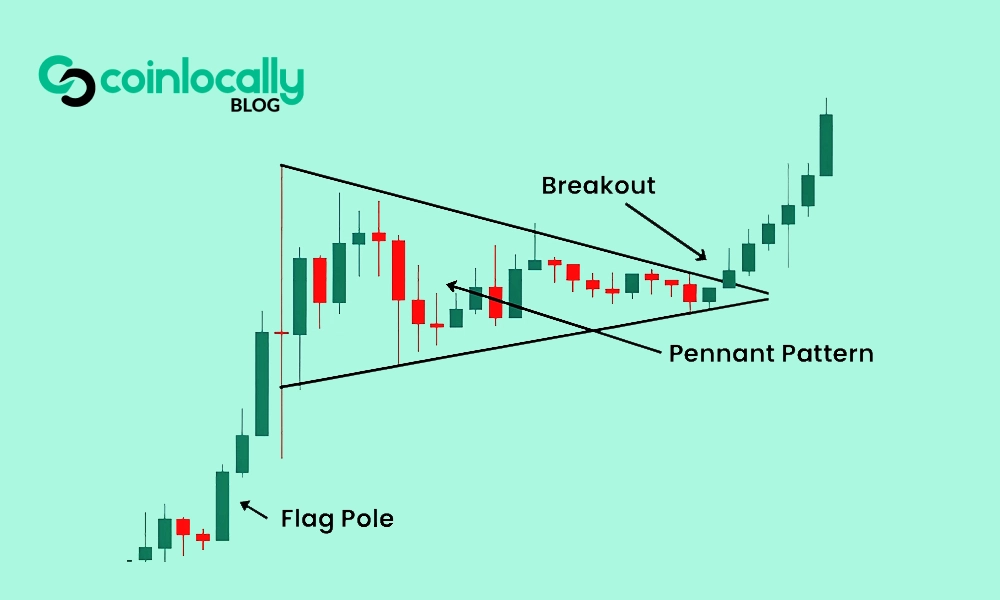
This pattern must have an existing uptrend before it can form. This initial sharp price movement or steep, rapid price increase leading into the pattern is known as the ‘pole’ or ‘flagpole’. The flagpole represents the primary trend and is often characterized by the formation of higher highs and higher lows. This impulse grows to a certain level.
A Pennant
This small symmetrical triangle forms as the market consolidates. During this pause, the asset accumulates between converging support and resistance lines. The consolidation period is marked by lower highs and higher lows, forming a triangle. The pennant should form after an uptrend has already begun. The consolidation range gets smaller as the trendlines converge until the stock eventually breaks out. The consolidation typically lasts between five and fifteen price bars and is generally completed within one to three weeks. The pennant can be horizontal or slightly tilted against the trend. The pattern consists of small-bodied candles that are contracting.
A Breakout
The final component is the breakout from consolidation. This is a decisive move above the upper trendline. It typically occurs to the upside, signaling a continuation of the uptrend. A breakout occurs when the price rushes above or below the boundaries of the pennant pattern. A strong price movement, a high volume, and a close outside the trend lines confirm a clear breakout. A breakout occurs when the stock’s price breaks out of the pennant’s resistance. A breakout can happen either at the point of contact of the converging lines or a little earlier.
How to Identify a Bullish Pennant
To identify a bullish pennant, you should watch for two elements: a pronounced upward movement known as the ‘pole’, and a price consolidation that forms a roughly symmetrical triangle with its support and resistance lines. Spotting a bullish pennant can be difficult, especially for beginners, due to its similarity to symmetrical triangle and bull flag patterns.
Key features to look for include:
- A pronounced impulsive price movement up before building the pennant itself.
- The formation of a pennant is a symmetrical triangle within the boundaries of converging support and resistance lines, with the price impulse located at an angle of 90 degrees to the triangle.
- A decline in trading volume occurs when the pattern is forming.
- When the price breaks out of the upper resistance line of the bullish pennant, a substantial volume rise occurs. A surge in trading volume typically accompanies an authentic breakout. The strongest breakouts occur on high volume.
The consolidation should not retrace more than 50% of the flagpole move. If the correction exceeds 50% of the flagpole height, the chances of a breakout and price rebound are lower.
Psychology Behind the Bullish Pennant
The bullish pennant pattern reflects a market that controls the buyers. Strong positive sentiment causes a market to spike higher (forming the pole). The buyers might then back off and take profit, while bears sense potential for a retracement. This parity between supply and demand causes price consolidation. This pause reflects a temporary balance between buyers and sellers before the trend resumes. This period is a psychological tug-of-war between bulls and bears, evaluating whether they overextended or if there is more potential. The pennant represents a battleground where recent volatility prompts traders to re-evaluate their strategies.
Eventually, in a bullish pennant, the positive sentiment wins out. Traders waiting to buy the market leap in and send it skyward again. When the breakout occurs, buyers have regained momentum and are likely to push prices even higher. The consolidation shows sellers cannot reverse the trend, merely slowing it down. Volume confirms conviction, as breakouts are often accompanied by increased trading volume. A diminishing volume and narrow price action during consolidation indicate that market consensus is still forming; the breakout manifests as a collective decision about the asset’s subsequent direction.
Trading the Bullish Pennant Pattern
Trading the bullish pennant pattern involves planning when to open your position, take a profit, and cut a loss. Here are the steps:
- Identify the Pattern Formation: Look for an existing uptrend and the formation of a pennant after that uptrend has begun.
- Wait for the Breakout: It is essential to wait for the breakout from consolidation before entering a trade. This breakout typically occurs to the upside. For conservative trading, wait for the breakout candle to close before entering. Waiting for a close above the upper trendline or a surge in volume can reduce the risk of false breakouts. A valid breakout happens only after the price has closed above that upper boundary.
- Enter a Trade: You can enter a trade once the breakout is identified. Most traders enter a long position when the price breaks above the pennant’s upper trendline. With moderate trading, open a position after the breakout, ensuring it is confirmed by growing volumes and impulsive price movement. Aggressive traders might enter inside the pennant, buying near the lower border. You can place a buy stop order right above the breakout point.
- Exit the Trade: Exit by taking profits or using a stop-loss order.
Bullish Pennant: Entry Points
There are two primary methods for choosing an entry point:
- Wait until the market breaks above its trend line (resistance for bullish pennants). This is a moderate strategy.
- Wait until the market retests its old resistance area (which becomes support) after the initial breakout. This is a more conservative strategy. By placing a buy order at this level, you can make the most of the following bull move.
- An aggressive trading strategy involves entering the pennant and buying when the price drops to the lower border.
Bullish Pennant: Profit Targets
The breakout often matches the size of the bull move that preceded the consolidation. To get your profit target, measure the size of that preceding upswing (the pole) and project it upward from the breakout point. Some traders aim for a profit target equal to the height of the uptrend leading into the pennant formation. The first target can be set at 50% of the flagpole height. The second target can be set at 100% of the flagpole height. Another method is to use the size of the base of the consolidation triangle (the pennant) for a more conservative target. The maximum height of the pennant pattern (distance between the lowest and highest points) can also be used.
Bullish Pennant: Stop Losses
Where you place your stop depends on your entry strategy.
- If you enter when the market breaks resistance, place your stop just beneath the support trendline. A stop loss should be set below the breakout point. Some traders prefer to put their stop losses below the breakout candle. With moderate trading, a stop loss is placed below the intersection point of the upper and lower borders.
- If you wait for the retest, place your stop a few points below your entry position. You need to give enough room for price oscillation, but not so much that losses are too significant if the pattern breaks.
- If you are aggressively trading inside the pennant, place the stop loss just below the point of intersection of the converging pennant lines.
Bullish pennants often have a higher risk-reward ratio than other patterns because the stop is typically much closer than the profit target.
Bullish Pennants vs. Other Patterns
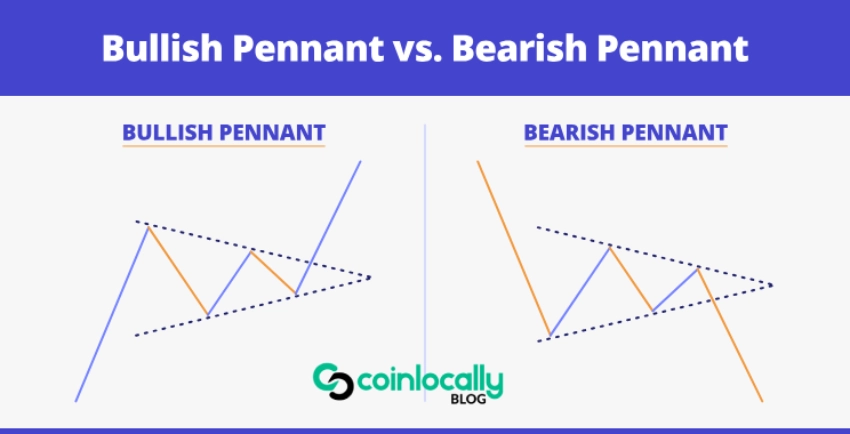
Bearish Pennants
Bearish pennants are essentially the opposite of bullish pennants. They indicate the impending continuation of a downward price move. Instead of consolidating after a move up, the market pauses on a significant move down. A bullish pennant arises after a pronounced upward move and indicates a bull market continuation, breaking out when the market moves beyond its resistance line. A bearish pennant arises after a pronounced downward move and suggests a bear market continuation, breaking out when it moves beyond its support line.
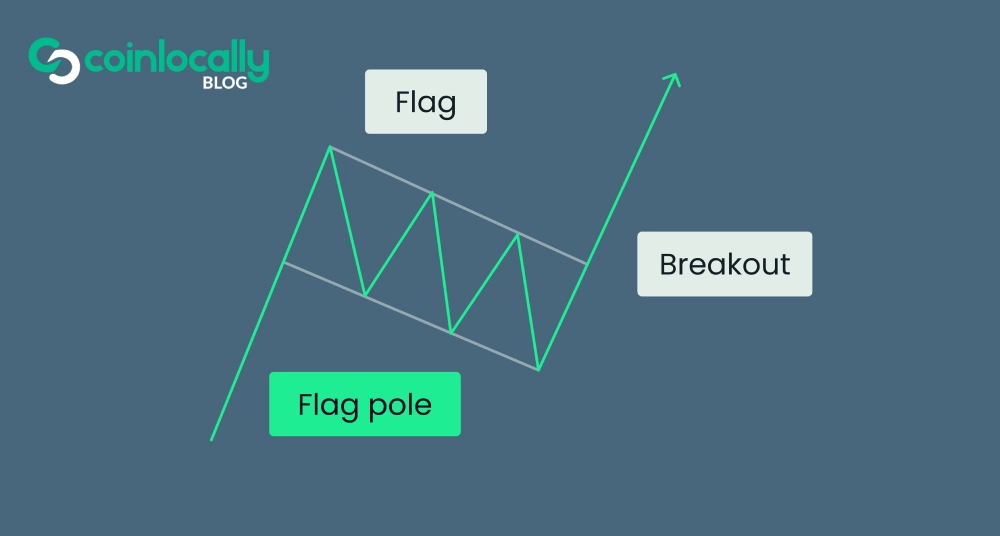
Bullish Flags
Like pennants, bullish flags are continuation patterns that follow a sharp price rally (flagpole). However, unlike bullish pennants, where the support and resistance lines form a triangle, the support and resistance lines in a bullish flag move in parallel. The flag pattern is encompassed by two parallel lines that can be flat or pointed in the opposite direction of the primary trend. The consolidation phase of a flag pattern involves more horizontal or slightly sloped rangebound movements. Flags are usually tighter than wedges.
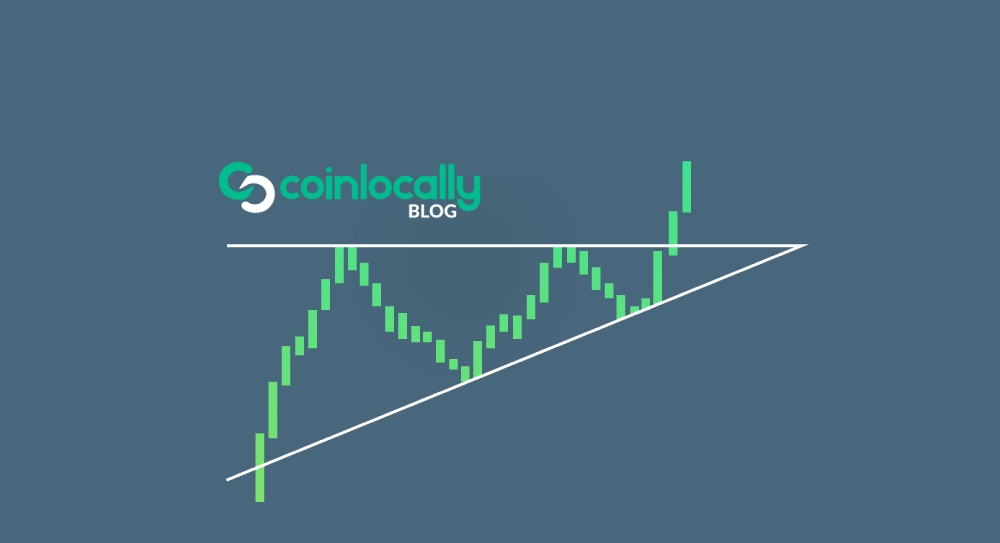
Symmetrical Triangles
The pennant pattern is similar to the symmetrical triangle pattern. However, the difference lies in the duration of the formation; the triangle pattern takes longer to build than the pennant. Unlike triangles, a significant upward move occurs before the pennant pattern forms. Pennants are typically more miniature and have symmetrical convergence compared to triangles.
Mistakes to Avoid
Common mistakes when trading bullish pennant patterns include:
- Entering too early: Jumping in before a confirmed breakout can lead to whipsaws.
- Ignoring volume: Weak volume on the breakout may indicate a lack of conviction.
- Confusing with other patterns: Ensure the pattern is a true pennant by checking for converging trendlines and a clear flagpole.
- Trading in isolation: Trading a bullish pennant pattern in the face of a downtrend is unfavorable, as the pattern is a trend continuation pattern.
- Entering too early in the range: Placing a buy-stop order too close to the consolidation range high can lead to being stopped out by overshoots.
- Inaccurate stop loss placement: Placing stop losses too close or far from the pattern can increase risk.
- Not validating with other indicators: Over-reliance on the pattern without cross-checking can lead to false signals.
- Poor risk management: Inadequate position sizing relative to stop loss.
- Lack of patience: Impulsive entries without waiting for optimal setups.
- Forceful trading against the trend: Not trading in the direction of the preceding trend.
- Letting losses run: Not sticking to stop loss levels.
Efficacy and Reliability of Bullish Pennant
Pennant patterns are considered among the most reliable continuation patterns. When accurately identified and interpreted, they reliably indicate the market’s imminent direction. The pattern’s structure provides a clear continuation signal with a logical entry point and target.
However, the reliability of pennant patterns can face scrutiny due to false breakouts. These misleading signals can deceive traders. Pennants can underperform, creating failed patterns, especially when there is insufficient volume during the breakout phase. Market context also affects reliability; patterns formed in highly volatile markets or during significant economic news releases may exhibit decreased reliability.
Accuracy Rate
The accuracy rate of a pennant pattern cannot be quantified with a specific percentage, as this is subjective and relies on visual interpretation. The accuracy differs depending on market conditions, timeframe, volume, and other confirmation indicators. Pennant patterns alone do not guarantee accurate predictions.
The pennant pattern has the potential to be profitable if traded correctly. Its ability to identify consolidations within strong trends makes it a high probability continuation pattern. The pattern clearly defines entry, stop loss, and take profit levels.
The pennant pattern is suitable for beginners as it is straightforward to identify and trade. Its visual shape is easy to recognize, and the rules for entries and stop losses are clearly defined.
Supplementary Indicators
To enhance analysis and confirm signals, traders can use supplementary indicators such as Volume indicators (like OBV, VWAP, MFI, DMI), Fibonacci retracements, Moving Averages, RSI, and MACD. Other technical indicators are used to confirm the validity and strength of the pennant pattern.
Bullish pennants can occur over many different time frames, from second or minute charts for day traders to weeks or months for longer-term traders. They are often found in short-term time frames (15 minutes to an hour) and appear less frequently in more extended periods. Pennant patterns can be applied across various time frames and markets, including stocks, forex, commodities, and cryptocurrencies.
Free Demo Account
IG provides tools like trading charts to help identify patterns, such as bullish and bearish pennants. They offer a free demo account with virtual funds to practice identifying and trading patterns without risking capital. You can learn more about technical trading and pattern trading through IG Academy.
CFDs are complex instruments, and 71% of retail client accounts lose money when trading CFDs with IG International. You can lose money rapidly due to leverage. Trading Contracts for Difference (CFDs) are complex financial instruments with a high risk of losing money rapidly due to leverage. Trading on margin carries a high level of risk and may not be suitable for all investors. Day trading can result in a total loss of capital. Short selling and margin trading can significantly increase your risk and even result in debt owed to your broker. Ensure you understand how these products work and whether you can afford the high risk of losing money. The information provided is for general purposes only and does not constitute investment advice.