Candlestick patterns provide valuable insights into price action, helping traders assess market sentiment and anticipate potential price movements. They serve as crucial tools for predicting upcoming shifts in the market, allowing traders to adjust their strategies promptly. Among these patterns, the Harami candlestick formations are prominent two-candle patterns signaling potential trend reversals. The Bearish Harami is a specific type that appears after an uptrend, suggesting buying momentum may fade and a reversal could be imminent. Recognizing and understanding this pattern and its variations can provide a significant edge in trading decisions.
This article delves into the Bearish Harami pattern, exploring its structure, the market psychology it reflects, and how to effectively incorporate it into trading strategies.
Table of Contents
What is a Bearish Harami Pattern?
The Bearish Harami candlestick pattern is a technical analysis charting pattern that signals a potential reversal from an uptrend to a downtrend. It typically forms during an uptrend, indicating a possible change in the trend from upward to downward.
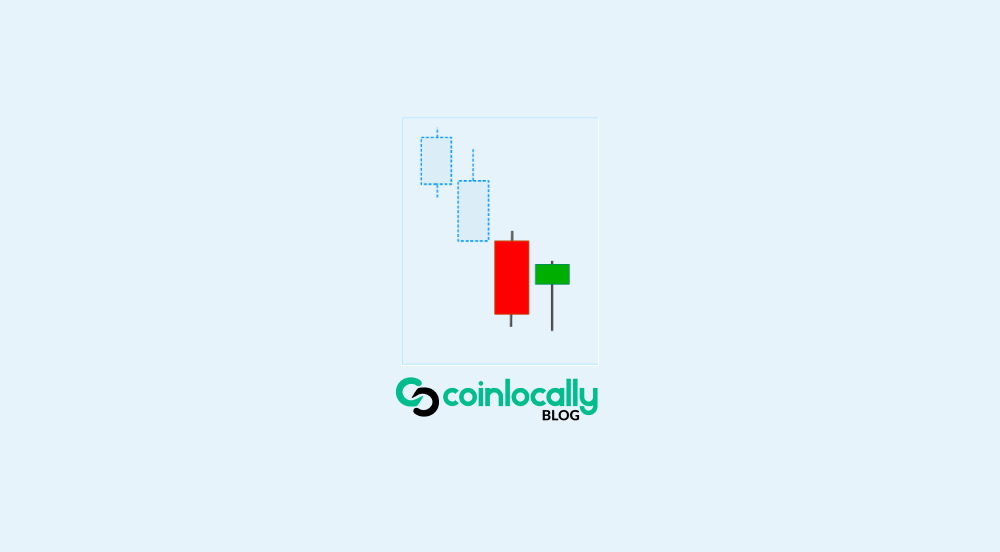
The pattern consists of two candlesticks:
The first candle
This is a large bullish candle. It reflects intense buying pressure and often has a long real body, typically following an established uptrend.
The second candle
This is a small bearish candle. Its crucial characteristic is that its body is entirely contained within the real body of the first, preceding large bullish candle. The term “Harami” originates from the Japanese word for “pregnant,” aptly describing the visual appearance where the smaller candle appears to be contained within the larger one.
The Bearish Harami pattern is usually considered a secondary candlestick pattern. While not as powerful as some other formations mentioned in candlestick pattern explanations, it is important for reading price and volume action.
Key characteristics to identify include:
- It must occur after an identifiable uptrend or strong bullish movement.
- The first candle is long and bullish.
- The second candle is small and bearish.
- The second candle’s body is fully contained within the first candle’s body.
- The size of the second candle influences the pattern’s potency; the smaller it is, the higher the chance of a reversal. A second candle with a tiny real body, almost a doji, characterizes the Harami Cross, a more powerful version of the Harami.
The Psychology Behind the Bearish Harami
The Bearish Harami pattern offers insights into the shifting sentiment within the market. The bullish candle signifies that bulls were in control and confident, increasing prices. However, the appearance of the small bearish second candle contained within the first suggests a change.
This indicates that the market is losing steam in the prevailing direction. During a bullish move, the Harami shows that strength in the previous candle is dissipating. The small body of the second candle, especially if it opens lower and closes lower, suggests a sudden drop in momentum. This can reflect reduced buying interest or early signs of selling pressure. The fact that the opening and closing prices of the second candle are very close indicates indecision in the marketplace, a signal of buyer exhaustion. After a period of price increase, this hesitation suggests fewer people are eager to buy at inflated prices, while sellers are ready to take profits, slowing the price increase.
The Bearish Harami becomes a subtle but meaningful warning sign that the prevailing uptrend may be running out of steam. Previously enthusiastic buyers may begin to take profits or hold off on new positions, and sellers may view this weakness as an opportunity.
Identifying a Bearish Harami Pattern
Identifying a Bearish Harami candlestick pattern involves looking for a specific two-candle formation after a clear uptrend.
Follow these steps to spot a Bearish Harami:
- Identify a significant uptrend in the chart. The pattern should occur at or after a sustained upward movement.
- Look for a large bullish candle that aligns with the prevailing uptrend. The preceding candle tends to be larger than the surrounding candles, signifying potentially climactic conditions.
- Check for a second candle immediately following the large bullish one. This second candle must be small and bearish (red or black).
- Confirm complete containment: Ensure the entire body of the small bearish candle is within the body of the preceding large bullish candle. This containment is a critical visual element. The color contrast between the bullish first candle (green/white) and the bearish second candle (red/black) is also essential.
- Consider volume: While not always required, lower trading volume on the second day compared to the first can support the idea of reduced buying activity and waning momentum.
Spotting the pattern is the first step; understanding its context and seeking confirmation are essential for trading decisions.
Bearish Harami vs. Related Patterns
Comparing the Bearish Harami to other patterns helps traders understand its specific role and significance.
Bearish Harami vs. Bullish Harami
The Bullish Harami pattern is the inverse of the Bearish Harami.
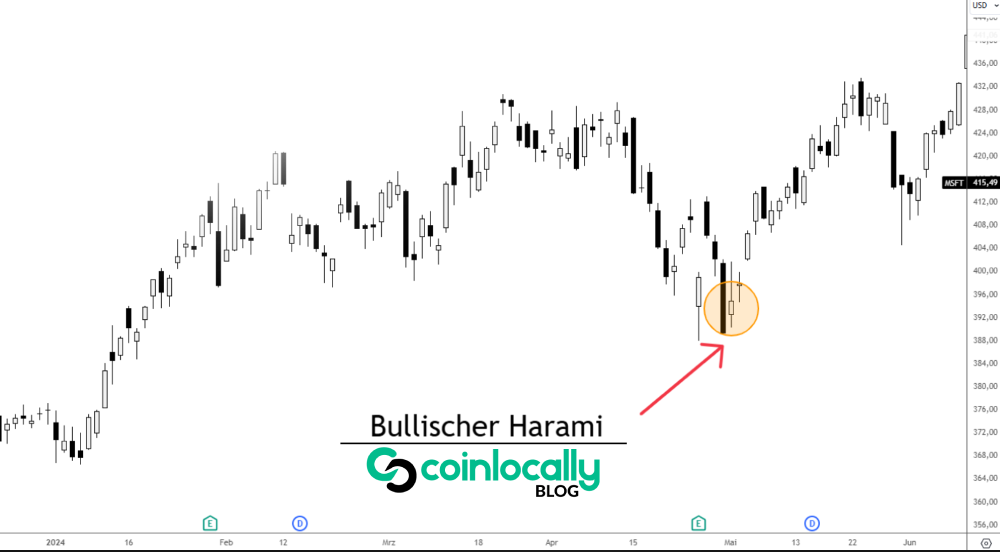
- The Bullish Harami appears after a downtrend and suggests a potential bullish reversal. It features a large bearish first candle followed by a smaller bullish second candle whose body is contained within the first. It signals that sellers are losing power and buyers are gaining control.
- The Bearish Harami forms after an uptrend and suggests a potential bearish reversal. It features a large bullish first candle followed by a smaller bearish second candle within the first. It signals that buyers are losing power and sellers are gaining control.
Both patterns share the characteristic of a smaller second candle contained within a larger first candle. Still, the preceding trend and the colors of the candles differentiate them, indicating opposite outcomes.
Bearish Harami vs. Bearish Engulfing
Both the Bearish Harami and the Bearish Engulfing pattern are two-candle patterns that signal a potential downward trend or reversal. However, they differ significantly in their formation and the strength of the signal they typically provide.
- In a Bearish Harami, the second candle is smaller and fits entirely within the body of the first candle. It indicates hesitation and a potential slowdown in momentum.
- In a Bearish Engulfing pattern, the second candle is larger and completely engulfs the first candle’s body. This pattern indicates a stronger downward trend or reversal signal, as the bears have more assertively taken control, covering the price range of the previous bullish move.
The larger size of the second candle and its full engulfment of the first make the Bearish Engulfing pattern a more robust indicator of a downtrend compared to the Bearish Harami.
Bearish Harami Cross
The Harami Cross is a notable variation of the Bearish Harami pattern. It occurs when the second candle in the Harami formation is a Doji. A Doji is characterized by having a very small or non-existent real body, where the opening and closing prices are equal or very close.
The lack of a significant real body in the second candle after a strong move in the prior candle tells traders with more certainty that the previous trend is coming to an end and a reversal may be at hand. The smaller the real body of the second candle, the better the formation is considered. The high or low of a Bearish Harami Cross setup often acts as resistance or support for subsequent price moves. This variation signals even greater indecision in the market than a standard Bearish Harami and may increase the likelihood of a reversal.
Trading Strategies Using the Bearish Harami Pattern
Trading the Bearish Harami pattern effectively involves more than just identifying the two candles; traders typically wait for confirmation and combine the pattern with other tools. Since the Harami is a secondary pattern, confirming its signals with additional trading tools is crucial.
Confirmation can come from a subsequent bearish candle, a break below key support levels, or signals from technical indicators. For example, a bearish candle following the Harami can confirm seller strength.
Here are several strategies traders can employ:
Trading Harami with Price Action
Using the Harami as part of a price action trading strategy means relying primarily on the price movements shown on the chart, without indicators or oscillators. Traders combine the Harami with chart patterns, support and resistance levels, and potentially Fibonacci levels.
A strategy involves identifying the Harami after an uptrend and then observing the subsequent price action. Waiting for further bearish confirmation strengthens the signal, such as a series of red candles or a recognizable bearish chart pattern (like a bearish pennant or channel breakdown). Traders can use support and resistance levels to manage the trade; if the price breaks support.