
Technical analysis is built on the idea that price action reflects all available information and that patterns in this data can help predict future movements. One of the most powerful tools in a trader’s arsenal is the Directional Movement Index (DMI). Developed by J. Welles Wilder in 1978, this indicator has become a staple for identifying trends and measuring their strength across various assets, from stocks and forex to cryptocurrencies.
In this article, we’ll explore the Directional Movement Index, how it works, how to interpret its signals, and how traders use it to make more informed trading decisions.
Table of Contents
What Is the Directional Movement Index?
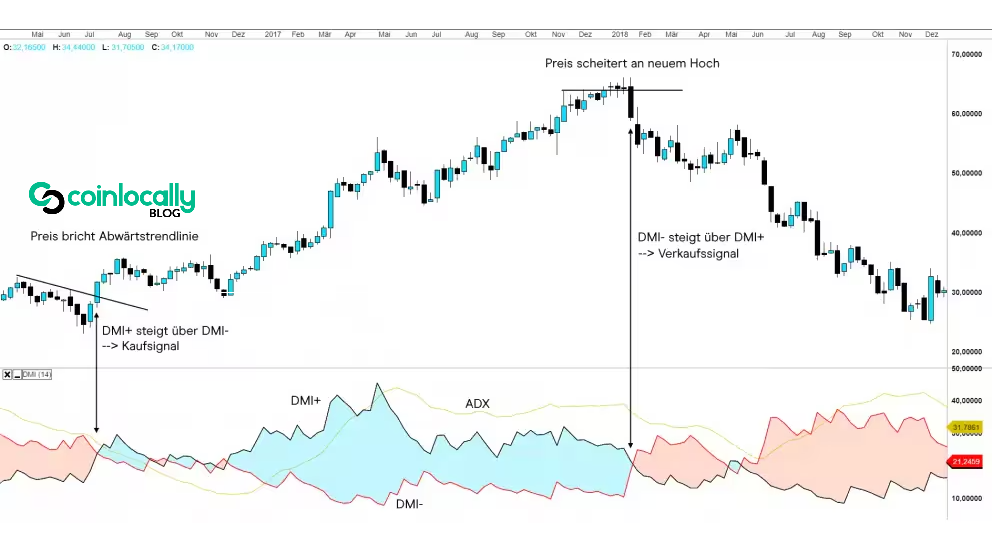
The Directional Movement Index is a trend-following indicator that helps traders determine a market trend’s direction and strength. It is made up of three key components:
- +DI (Positive Directional Indicator): Measures the strength of upward price movement.
- –DI (Negative Directional Indicator): Measures the strength of downward price movement.
- ADX (Average Directional Index): Measures the overall strength of the trend, regardless of its direction.
Together, these lines create a comprehensive view of market momentum and help traders decide when to enter or exit trades based on trend behavior.
How the Directional Movement Index Works
The Directional Movement Index calculates trend strength by comparing the current high and low prices with the previous day’s. It then generates values for the +DI and –DI lines based on the direction of the movement. The ADX line is derived from the absolute difference between the +DI and –DI over a selected period, typically 14 days.
Here’s a breakdown of how each component functions:
- When +DI is above –DI, the market is considered an uptrend.
- When DI is above +DI, the market is in a downtrend.
- The ADX line doesn’t indicate trend direction but rather the trend’s strength. Values above 25 generally signal a strong trend, while values below 20 suggest a weak or non-trending market.
By analyzing the crossover points and the ADX value, traders can gain insight into whether a trend exists and how reliable or actionable it might be.
Interpreting the DMI in a Trading Context
Understanding how to read the Directional Movement Index can significantly improve timing and decision-making. Let’s look at a few common interpretations.
Trend Identification
The DMI is highly effective for identifying the direction of a trend. When the +DI crosses above the –DI, it typically signals a bullish market. Conversely, when DI crosses above +DI, it indicates a bearish trend. These crossover points often align with potential entry or exit signals.
Measuring Trend Strength with ADX
The ADX line enhances the utility of the Directional Movement Index by showing how strong a trend is, regardless of its direction. For example:
- ADX above 25: Strong trend (either bullish or bearish)
- ADX below 20: Weak or sideways market
- ADX rising: Increasing trend strength
- ADX falling: Weakening trend
This information can be critical when deciding whether to let profits run or to tighten stop-loss orders.
Filtering False Signals
One of the biggest challenges in trading is avoiding false breakouts or trend reversals. The Directional Movement Index helps filter out noise by requiring bidirectional agreement (+DI or –DI crossover) and sufficient strength (ADX above 25). This dual-confirmation approach adds confidence to trading signals and reduces the chance of acting on unreliable movements.
Using the Directional Movement Index in Trading Strategies
Trend-Following Strategy
A common way to use the DMI is in a trend-following system. Here’s how it might work:
- Wait for the +DI to cross above –DI, indicating a potential uptrend.
- Check that ADX is above 25, confirming that the trend is strong.
- Enter a long trade with a stop-loss below the recent swing low.
- Consider exiting when DI crosses back above +DI or ADX declines.
This same strategy can be reversed for short positions using the opposite DI crossover.
Combination with Other Indicators
The Directional Movement Index is often combined with other indicators to improve accuracy. For example:
- Moving Averages can confirm trend direction.
- Relative Strength Index (RSI) can help identify overbought or oversold conditions.
- MACD can validate momentum shifts.
Using the DMI alongside other tools, traders can create a more holistic trading plan that reduces false signals and optimizes timing.
DMI in Volatile Markets
The DMI performs best in trending markets and is less effective in sideways or highly volatile conditions without clear direction. In such environments, traders may rely on different indicators or shorten their timeframes to avoid false readings. Evaluating market context before placing trades based solely on the DMI is essential.
Limitations of the Directional Movement Index
While powerful, the Directional Movement Index is not perfect. Like all lagging indicators, it is based on historical price data, which may react slowly to sudden changes or new trends. This lag can result in late entries or missed opportunities.
In choppy or range-bound markets, the DMI may produce frequent crossover signals that don’t lead to sustained price moves, resulting in whipsaws. For this reason, many traders use the DMI as part of a broader strategy rather than a standalone tool.
Tips for Maximizing the DMI’s Effectiveness
- Use Multiple Timeframes: Check the DMI on short-term and long-term charts to confirm alignment.
- Wait for Confirmation: Don’t rely solely on DI crossovers—confirm with ADX strength or other indicators.
- Customize Your Settings: While the default period is 14, some traders adjust it based on volatility or asset type.
- Backtest Your Strategy: Before applying the DMI to live trades, test it on historical data to evaluate performance.
Conclusion
The Directional Movement Index is a versatile and insightful tool that can help traders identify trends, measure their strength, and refine their entry and exit points. By combining the directional indicators (+DI and –DI) with the ADX line, traders gain a powerful lens to view market momentum and trend dynamics.
While no indicator guarantees success, the Directional Movement Index clarifies trending markets and helps filter out weak or false signals. Used wisely and with other tools, the DMI can become a core component of a disciplined, data-driven trading strategy.