The world of technical analysis offers various tools for traders to predict market movements and identify potential trend reversals. Among these tools, candlestick patterns stand out for their ability to provide visual cues about market sentiment and possible shifts. The hammer candlestick pattern is a key formation that traders use to signal potential reversals, especially after a price decline. Understanding the hammer candlestick chart pattern’s structure, psychology, and strategic application can give traders a valuable edge.
Table of Contents
Understanding the Hammer Candlestick Pattern
A hammer candlestick is a technical analysis indicator that signals a potential reversal in the market. Traders recognize it by its distinctive shape, which includes a small body at the top and a long lower shadow. This pattern visually suggests that sellers pushed prices lower during a trading period, but buyers stepped in and drove the price back up to close near the opening price. This “hammering” action often indicates that selling pressure is weakening, potentially leading to a bullish reversal.
Structure and Formation
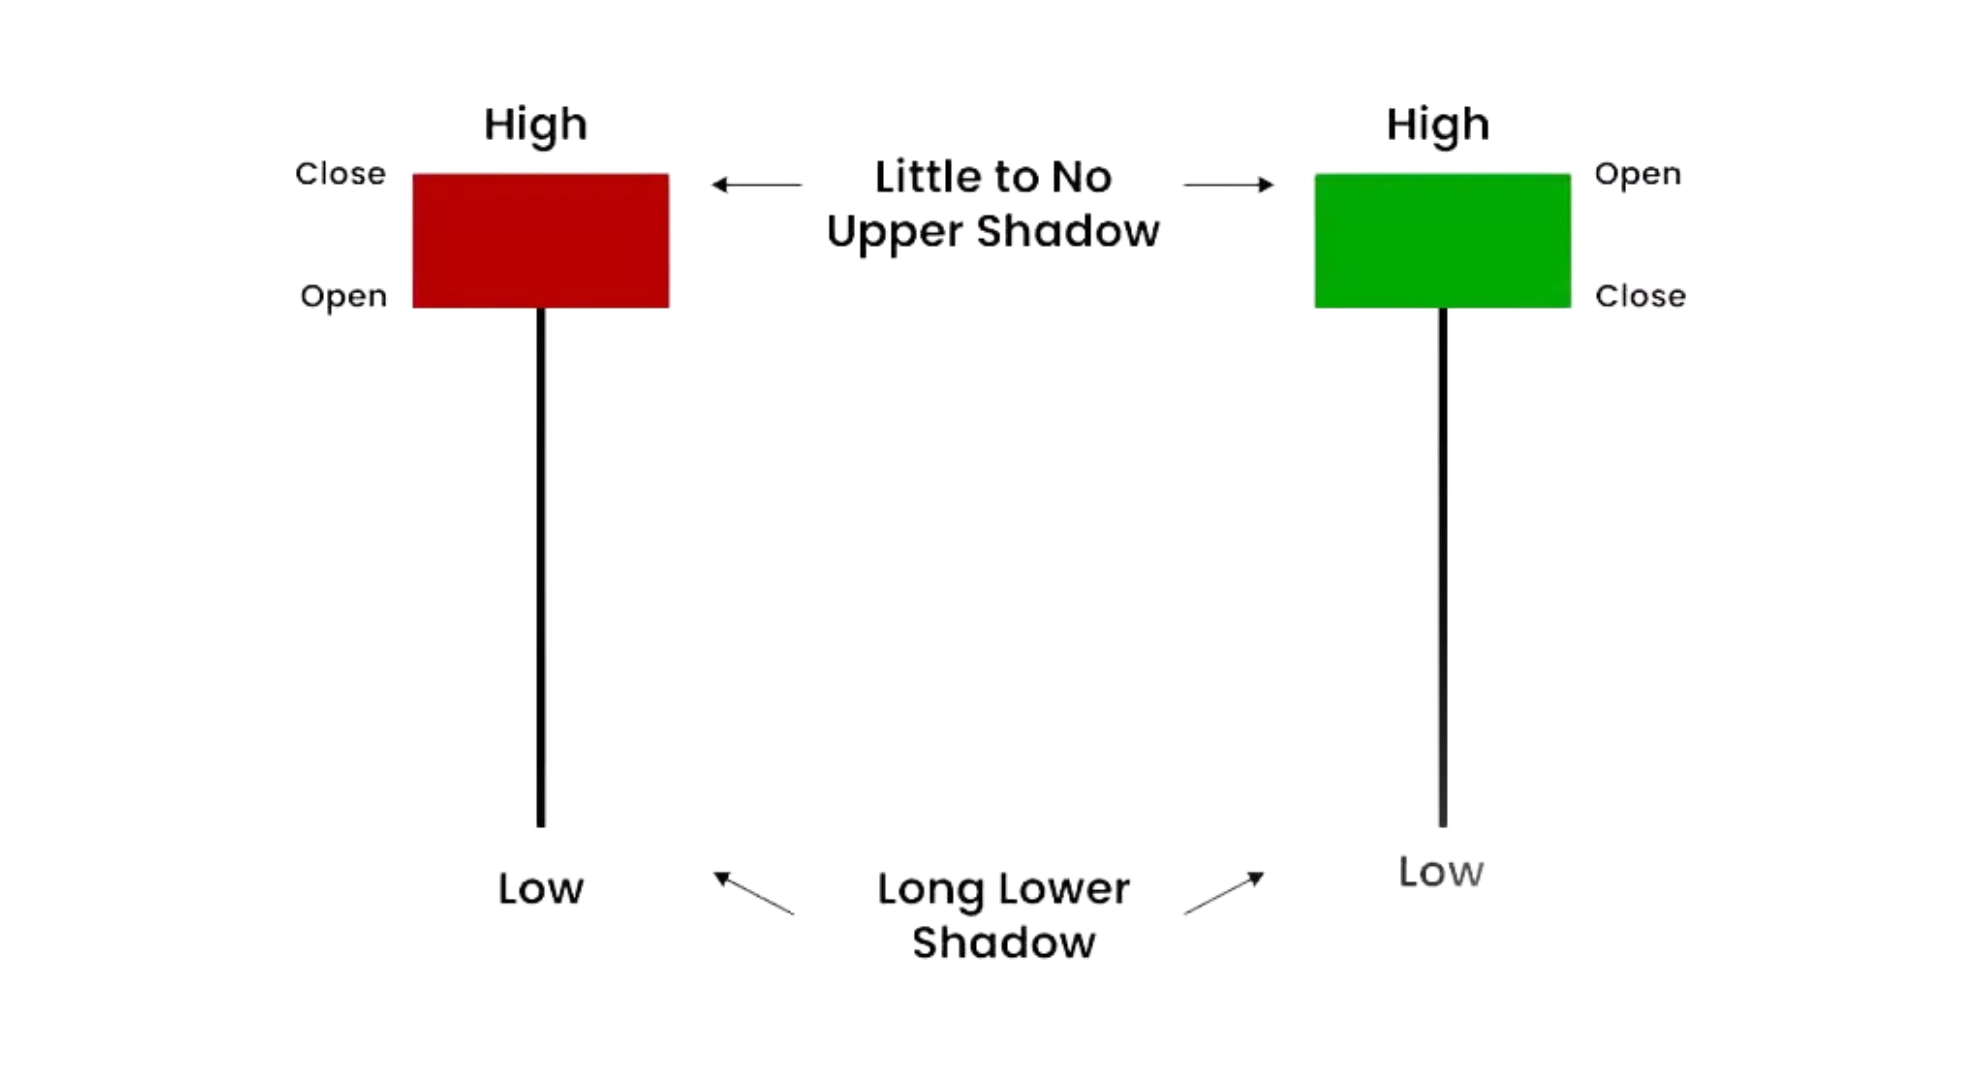
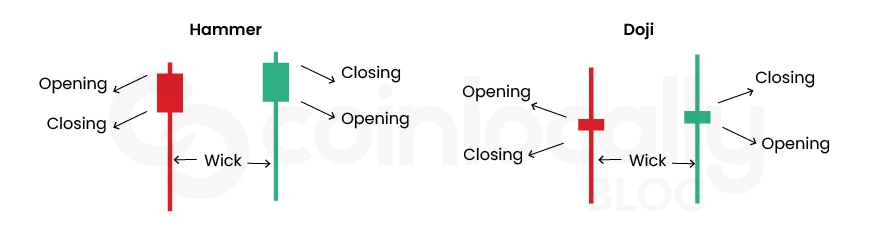
Identifying a hammer candlestick pattern involves observing specific structural characteristics. An actual hammer has a small real body near the handle’s top. The most prominent feature is its long lower shadow (or wick), which measures at least twice the length of the body. This elongated lower shadow visually represents the price falling significantly during the session before buyers aggressively pushed it back up. The pattern typically features minimal or no upper shadow, emphasizing the struggle at lower price levels. The hammer’s body can appear bullish (green or white) or bearish (red or black). While both colors are considered valid hammer patterns, a green body often provides a stronger bullish signal, showing the price closed higher than it opened.
Formation of Hammer Candlestick
The formation of a hammer reflects market dynamics where sellers initially dominate the session, pushing the price lower. However, buyers begin to step in as the price drops, counteracting the selling pressure and driving the price back up. By the session’s close, the price recovers to a level close to the opening price, forming the small body near the top and leaving the long lower shadow. This recovery indicates that buyers were able to absorb the selling pressure and lift the price back up, suggesting the existing downtrend may be weakening.
Psychology Behind the Pattern
The hammer candlestick pattern encapsulates a psychological shift in market sentiment. During the pattern’s formation in a downtrend, initial intense selling pressure drives the price down. This reflects a bearish sentiment among traders. However, the emergence of buyers, as indicated by the long lower shadow, demonstrates enough demand to push the price back up, countering the selling pressure. By the end of the session, the price’s recovery near the opening level and the formation of the small body near the top signify a reduction in bearish sentiment and a potential shift towards bullish sentiment. This psychological shift is crucial, as it can precede a market reversal or a bounce at a support level.
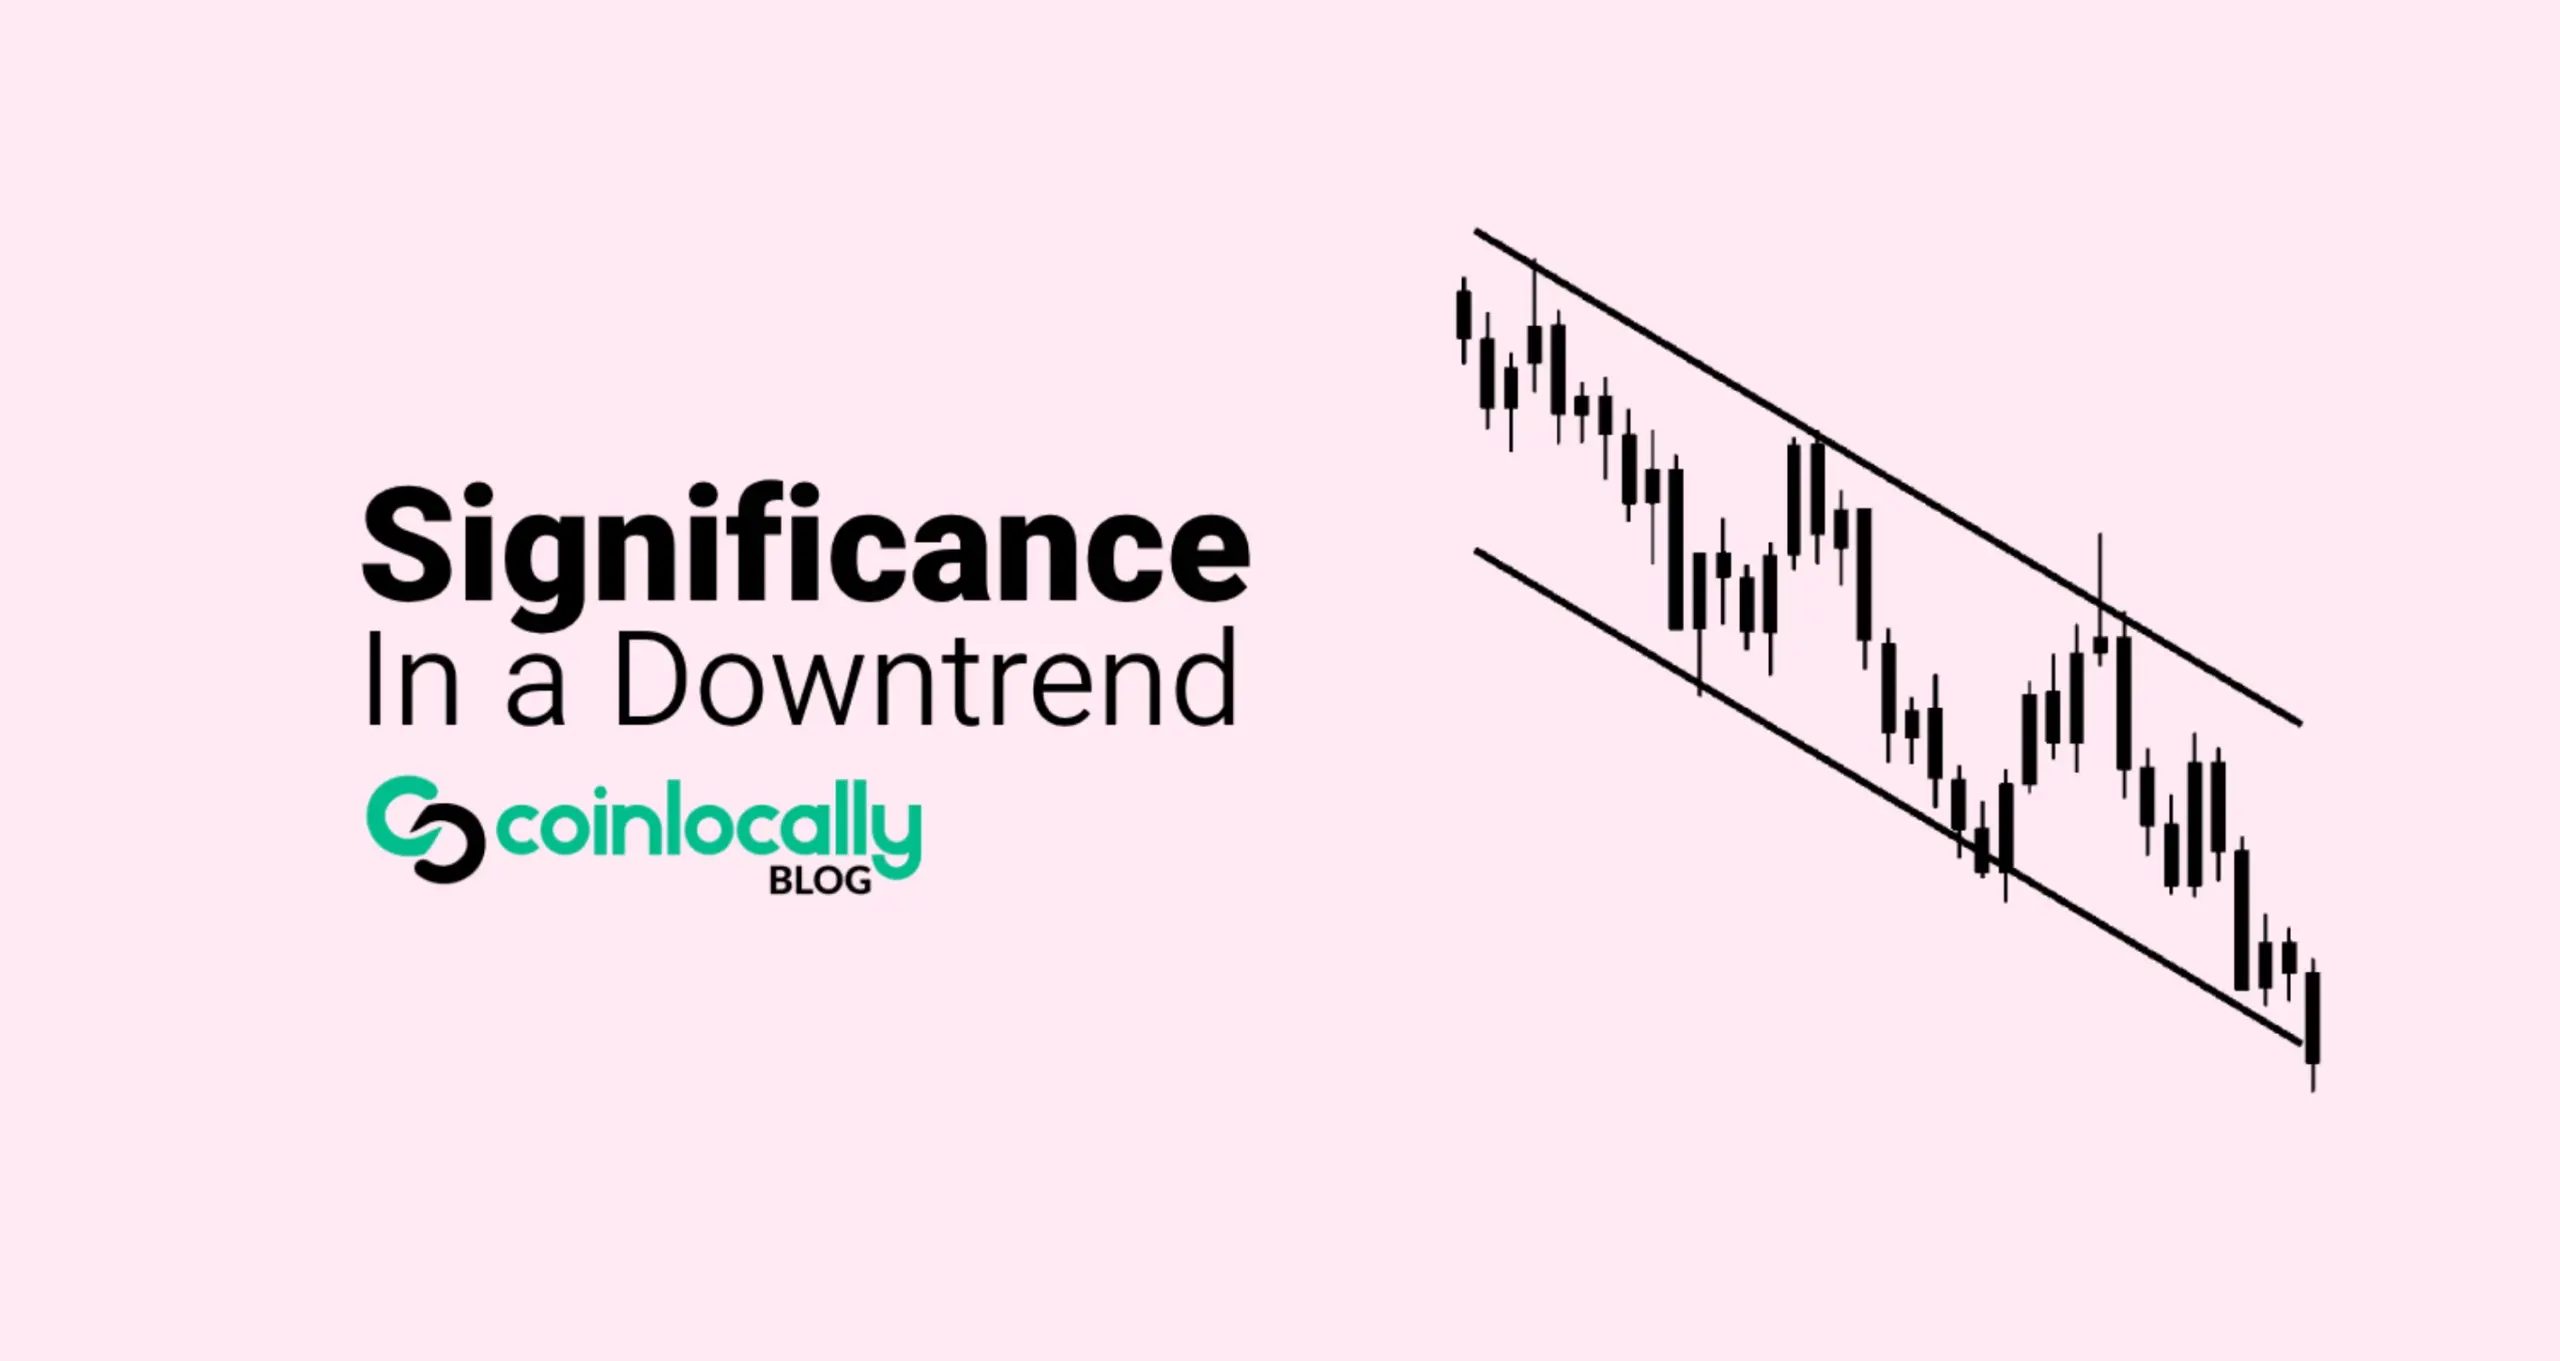
Significance in a Downtrend
The hammer candlestick pattern holds the most significance and reliability when it appears at the bottom of an established downtrend. In this context, the pattern is a potential signal for a bullish reversal. The presence of a hammer after a series of lower lows and lower highs reinforces the idea that the market is in a bearish phase and that this pattern may indicate a potential floor or support level where buyers are willing to step in. This positioning strengthens the pattern’s relevance as a reversal signal, suggesting that a bullish move may follow as sellers lose momentum.
Reliability and Limitations
While the hammer candlestick is a popular and valuable tool for identifying potential reversals, it is not foolproof and has limitations. The pattern signals the possibility of a bullish reversal but does not guarantee it will happen. When used alone, the hammer has an approximate 40% failure rate, and its reliability is often cited as around 40-60%. Relying solely on this pattern without confirmation can lead to false signals and premature trades.
Hammers can form during a downtrend, but selling pressure may persist, resulting in a false signal where the price does not reverse as expected. The pattern also tends to be less effective and generates more false signals during periods of high market volatility. Therefore, traders should always wait for confirmation and combine the hammer pattern with other analysis tools to increase reliability.
Types of Hammer Candlestick Patterns
The term “hammer pattern” often refers to several related candlestick formations, each with unique implications depending on the market context. Understanding these variations helps traders interpret market behavior more accurately.
Bullish Hammer Candlestick
The bullish hammer candlestick pattern is the most common type and is typically found at the bottom of a downtrend. It signals that sellers attempted to push prices lower during the session but were overpowered by buyers, causing the price to close near the opening level. This shift in control from sellers to buyers often hints at a bullish reversal. As mentioned, a green body strengthens the bullish signal.
Bearish Hammer Candlestick (Hanging Man)
The bearish hammer candlestick pattern is also known as the hanging man. While it shares the same shape as a bullish hammer, its significance comes from its position at the top of an uptrend. The hanging man signals a potential reversal to the downside. It indicates that buyers attempted to increase prices, but sellers gained control and drove prices down during the session. Although the price may close near the open, the long lower shadow suggests weakening buying pressure, and traders see this as a warning sign that the trend could reverse downward. A red-colored body often strengthens the bearish signal.
Inverted Hammer Candlestick
The inverted hammer candlestick pattern appears at the end of a downtrend and signals a potential bullish reversal. Unlike the classic hammer, the inverted hammer candlestick pattern has a petite body at the bottom with a long upper shadow and little to no lower shadow. This pattern reflects indecision in the market but hints that buying interest is increasing. The long upper shadow shows buyers pushed the price higher during the session, but sellers brought it back near the open. While sellers retained some control, the upper shadow indicates buyers’ growing strength. Like the regular hammer, the body color can be green or red, but a green inverted hammer candlestick pattern typically signals more substantial bullish potential.
Red vs Green Hammer Color Significance
The color of a hammer or inverted hammer candlestick can provide additional nuance to its interpretation, although the pattern’s position and shape are generally more critical. A green hammer candlestick or green inverted hammer closes higher than its opening price. This reinforces the bullish reversal signal, indicating that buyers were in control by the end of the session. A red hammer candlestick or red inverted hammer closes lower than its opening price. While traditionally a green hammer is considered more bullish, a red hammer can still be a bullish reversal signal. The long lower shadow (or upper shadow for an inverted hammer) remains the key feature, showing the rejection of lower prices or an attempt to push higher. The failure to make the close higher in a red hammer suggests some residual selling pressure, prompting caution and a greater need for additional confirmation.
Double Hammer Pattern
The Double Hammer Pattern is a rare but powerful reversal signal that appears when two consecutive hammer candlesticks form at the bottom of a downtrend. This pattern indicates sellers attempted to push prices lower twice, but buyers stepped in and successfully pulled prices back up both times. This repeated rejection of lower prices strengthens the signal for a potential bullish reversal. The presence of two hammers reflects strong buying interest and suggests the market is preparing for an upward move. Traders often consider this pattern more reliable than a single hammer.
Trading Strategies Using Hammer Patterns
Spotting a hammer candlestick is the first step; effective trading requires using the pattern within a broader strategy, including confirmation, entry and exit points, and risk management.
Confirmation is Key
Traders must wait for confirmation before acting on a hammer signal to reduce the chances of a false signal. The most common confirmation is a bullish candlestick in the next session that closes above the hammer’s high. This confirms buying pressure and increases the likelihood of an upward move. Additionally, a significant increase in trading volume during the hammer’s formation or on the confirmation candle suggests stronger buying interest, making the signal more reliable. Higher volume indicates more market participants are engaged, and the pattern might have a more substantial impact.
Combining with Support/Resistance and Other Indicators
The reliability of a hammer candlestick pattern increases significantly when combined with other technical analysis tools and market context. Look for hammers appearing near strong support levels or demand zones, as this reinforces the potential for a reversal. A hammer pattern near a support line or trendline signals a higher chance of a reversal. Confluence with Fibonacci retracement levels or pivot points also enhances reliability. Pairing the hammer with technical indicators like the Relative Strength Index (RSI) or Moving Average Convergence Divergence (MACD) can provide additional confirmation. For instance, if the RSI shows the stock is oversold (below 30) and a hammer forms, it strengthens the case for a bullish reversal.
Entry and Exit Points
Using the hammer pattern strategically helps define entry and exit points. More aggressive traders may enter if the confirmation candlestick closes above the hammer’s high. Others may join at the day’s opening, following the confirmation candle.
Setting profit targets is crucial. Traders usually set profit targets using nearby resistance levels, moving averages, Fibonacci retracements, or pivot points. Before entering a trade, traders typically want to ensure the market has enough room to move to achieve their minimum risk-reward ratio before hitting resistance.
Risk Management
Effective risk management is essential when trading hammer patterns. The most common approach involves placing a stop-loss order below the hammer’s low. If the price falls below the hammer’s low, the pattern has failed, and exiting the trade helps minimize potential losses.
Some traders may tighten the stop-loss to just below the hammer’s body to reduce risk further if the price moves aggressively upward. Using a minimum risk-to-reward ratio, such as 1:2, ensures potential profits are at least double the risk. This approach can help maintain profitability even if only a portion of trades are successful. Monitoring the trade and adjusting stop-loss and profit targets based on market conditions is also advised.
Considering Time Frames
The hammer candlestick pattern can appear on various time frames, including daily, hourly, or minute charts. While the pattern can be observed in any time frame, hammers in more extended time frames, like daily or weekly charts, tend to be more reliable as market noise is minimized.
However, they also appear frequently on shorter time frames, which traders may use, sometimes paired with more extended time frames for context. The frequency of the inverted hammer candlestick pattern also depends on factors like market volatility and the timeframe being analyzed; it occurs more frequently in shorter time frames than longer ones. Using multiple time frame analyses can provide a more complete picture.
Distinguishing Hammer Patterns from Similar Formations
Several candlestick patterns share visual similarities with the hammer, but their position within the trend changes their meaning entirely. Traders must understand these distinctions to avoid misinterpretations.
Hammer vs. Hanging Man
The hammer and hanging man candlestick look similar, featuring a small body at the top with a long lower shadow and little to no upper shadow. The crucial difference lies in their position within the trend. A hammer at the bottom of a downtrend signals a potential bullish reversal. In contrast, a hanging man appears at the top of an uptrend and signals a possible bearish reversal.
Hammer vs. Doji
The hammer candlestick and the doji are considered reversal patterns in technical analysis, but differ significantly in structure and meaning. A hammer has a petite body at the top with a long lower shadow, indicating buyers regained control after sellers pushed prices lower.
A doji, on the other hand, forms when the open and close prices are almost identical, resulting in a body that looks like a cross or plus sign. A doji shows market indecision rather than a clear reversal signal, though it can indicate a possible trend reversal, especially in an uptrend or downtrend. A hammer is a clearer reversal signal, particularly in downtrends, while a doji primarily highlights market hesitation.
Inverted Hammer vs. Shooting Star
The inverted hammer candlestick and shooting star patterns share the same visual structure: a small body at one end with a long shadow on the opposite side. Like with the hammer and hanging man, the key difference is their position within the trend and the signal they provide.
The inverted hammer candlestick pattern appears at the end of a downtrend and suggests a potential bullish reversal. The shooting star pattern appears at the top of an uptrend and signals a possible bearish reversal. The inverted hammer indicates buyers attempted to push prices higher, while the shooting star shows buyers pushing prices up but sellers driving them back down, indicating potential selling pressure.
Common Mistakes To Avoid in Hammer Candlestick Pattern Trading
Traders can fall into several common pitfalls when using the hammer candlestick pattern. Avoiding these mistakes increases the pattern’s effectiveness and helps protect trading capital. A primary mistake is trading without confirmation. The hammer signal alone does not guarantee a reversal, and relying solely on the pattern without waiting for a subsequent bullish candle, checking volume, or using other indicators often leads to false signals.
Another pitfall is ignoring market context and the overall trend. A hammer is most reliable in specific contexts, such as at the bottom of a downtrend or near established support levels. Overreliance on single candlestick patterns without considering other technical analysis tools is also risky. Finally, neglecting stop-loss strategies when trading hammer patterns can lead to significant losses if the anticipated reversal fails.
Conclusion
The hammer candlestick pattern is a valuable tool in technical analysis. It offers insights into potential market reversals, particularly at the end of downtrends. Its structure, characterized by a small body and a long lower shadow, visually represents buying pressure overcoming initial selling pressure. Recognizing variations like the inverted hammer candlestick pattern and understanding the distinction between a hammer and formations like the hanging man or doji are crucial for accurate analysis.
The hammer pattern may indicate a potential bullish reversal. However, traders should prioritize confirming this signal through subsequent price action, volume analysis, and additional technical indicators. Combining the pattern with support levels, trendlines, or Fibonacci retracements enhances its reliability. Effective trading strategies incorporate clear entry and exit points based on the pattern and confirmation, as well as disciplined risk management techniques like setting stop-loss orders below the hammer’s low.
Ultimately, no single pattern guarantees trading success. The hammer candlestick chart pattern is best used in a comprehensive trading plan that considers the overall market context, employs multiple analytical tools, and prioritizes prudent risk management. By mastering the hammer’s identification, interpretation, and strategic application, traders can potentially improve their decision-making and market outcomes.
Frequently Asked Questions
What is a Hammer Candlestick Pattern?
A hammer candlestick pattern is a chart formation appearing at the bottom of a downtrend. It has a small body at the top and a long lower shadow, signaling a potential bullish reversal as buyers regain control.
Is a Hammer Candlestick Pattern Bullish or Bearish?
The hammer candlestick is primarily a bullish pattern, indicating the potential for a price reversal to the upside.
How reliable is the Hammer Candlestick Pattern?
When used alone, the hammer pattern has an approximate 40-60% success rate. Its reliability increases significantly with confirmation signals, support levels, volume, and other technical indicators.
What is the difference between a Hammer and Hanging Man Candlestick?
The key difference is their position in the trend. A hammer candlestick at the bottom of a downtrend signals a bullish reversal, while a hanging man candlestick at the top of an uptrend indicates a potential bearish reversal.
Can a Hammer Candlestick Pattern appear in an uptrend?
No, a hammer candlestick is typically associated with downtrends and acts as a bullish reversal signal. A similar shape is usually classified as a hanging man pattern in an uptrend, indicating bearish potential.
What does a Red Hammer Candlestick indicate?
A red hammer candlestick shows buyers pushed the price up from the lows, indicated by the long lower shadow, despite closing below the open. While a green hammer is traditionally considered stronger, a red hammer can still suggest a bullish reversal. This is especially true when there is confirmation.
What is an Inverted Hammer Candlestick Pattern?
The inverted hammer candlestick pattern forms at the end of a downtrend and signals a potential bullish reversal. It has a small body at the bottom and a long upper shadow.
Is an Inverted Hammer Bullish or Bearish?
An inverted hammer candlestick pattern is considered bullish during a downtrend. A green inverted hammer reinforces the bullish signal.
How can I confirm the hammer pattern?
Confirmation is crucial. Look for a strong bullish candlestick following the hammer, ideally closing above the hammer’s high. Increased volume during or after the hammer’s formation adds further confirmation. Using other indicators like RSI or support levels also helps.