The bull flag is one of the most potent and reliable chart patterns traders use in technical analysis. Whether you’re involved in crypto, stocks, or forex, understanding how to identify and trade this bullish continuation pattern can give you a significant edge in trend-based strategies. This guide will walk you through the bull flag pattern, how to spot it, why it works, and how to trade it confidently.
Table of Contents
What Is a Bull Flag?
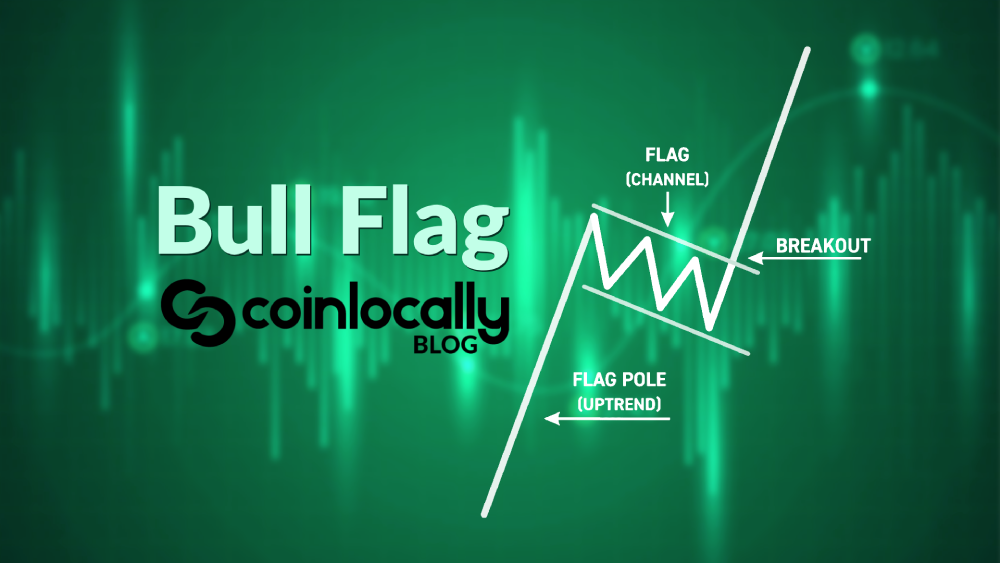
A bull flag is a continuation chart pattern that appears after a strong upward price move (the “flagpole”) and is followed by a short period of consolidation (the “flag”) before the price resumes its upward momentum.
Components of a Bull Flag:
- Flagpole: A steep and aggressive price rally caused by heavy buying.
- Flag: A downward-sloping or sideways price consolidation typically forms a parallelogram or rectangle.
- Breakout: A surge in price above the flag’s upper trendline, signaling continuation of the trend.
This pattern represents a pause in a bullish trend, often due to short-term profit-taking. Once this phase is over, buyers usually return to push the price even higher.
Why the Bull Flag Pattern Matters
The bull flag is essential for traders because it offers a high-probability setup with a clear entry, stop-loss, and take-profit level. It allows you to:
- Enter trends with less risk: You’re trading a continuation, not a reversal.
- Ride momentum safely: You’re joining after confirmation of the trend’s strength.
- Define risk and reward easily: Based on the flag structure and pole measurement.
Professional traders use this pattern across markets—from cryptocurrencies like Bitcoin and Ethereum to traditional assets like Apple, Tesla, and the S&P 500.
How to Identify a Bull Flag Pattern
Recognizing a bull flag involves more than just drawing lines. Here’s what to look for:
1. Strong Flagpole
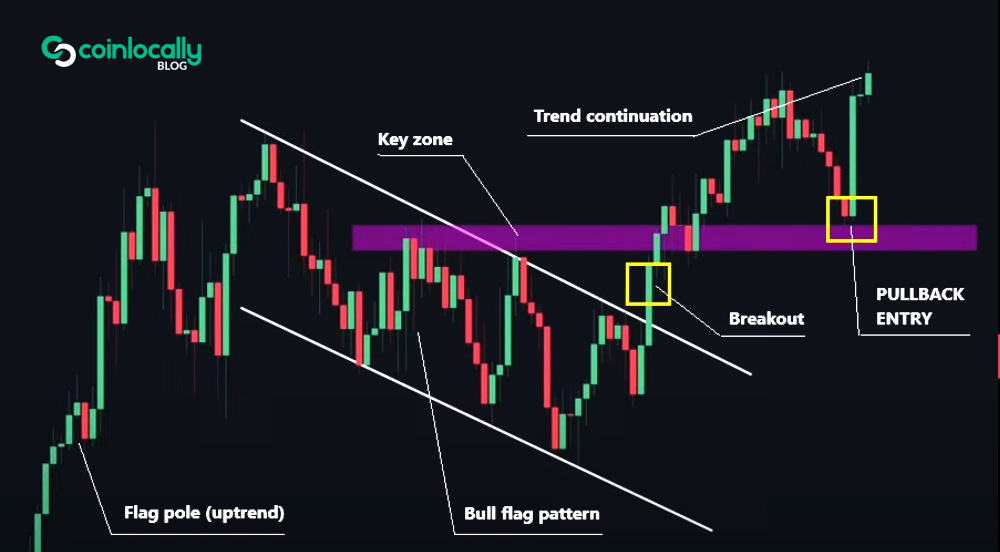
The first part of the pattern should show a strong, near-vertical move upward. This rally is usually supported by high volume and represents strong buying momentum.
2. Controlled Pullback (The Flag)
After the price peaks, a short-term consolidation follows. This can be downward-sloping (a correction) or sideways (a pause). The key is that this move is gentle, does not retrace more than 50% of the flagpole, and forms a defined channel.
3. Decreasing Volume During the Flag
Volume usually decreases during the flag portion. This signals temporary exhaustion of buying and selling pressure—an essential precursor to a breakout.
4. Breakout Confirmation
The breakout occurs when the price surges above the upper boundary of the flag. Ideally, this move is accompanied by increased volume, confirming the return of bullish momentum.
How to Trade a Bull Flag Pattern
Trading the bull flag is all about timing and confirmation. Here’s how you can build a strong strategy around it:
✅ Entry
Enter Entryrade when the price exceeds the flag’s upper resistance line. Conservative traders often wait for the candle to close above this level for added confirmation.
✅ Stop-Loss
Set your stop-loss just below the flag’s lower trendline. This will protect you if the breakout fails and the price reverses.
✅ Profit Target
Measure the length of the flagpole and add it to the breakout point to set your profit target. This projection gives you a clear, logical price objective.
✅ Risk-Reward Ratio
Ensure your potential reward is at least twice your risk. Bull flag setups often offer 2:1 or 3:1 ratios, making them attractive for swing traders and day traders.
Example of a Bull Flag in Crypto
Imagine a token jumps from $1.00 to $1.80 quickly (flagpole), then consolidates between $1.65 and $1.75 for several hours (flag). Once it breaks above $1.75 with substantial volume, the next likely move is a continuation toward $2.60—the original pole added to the breakout level.
This type of setup is common in volatile markets like crypto, where patterns form and resolve quickly.
Common Bull Flag Mistakes
Avoid these errors when trading the bull flag:
- Entering Too Early: Wait for the breakout, not just the pattern formation.
- Ignoring Volume: Volume is a key signal for confirmation.
- Trading Deep Pullbacks: If the flag retraces more than 50% of the pole, it’s likely invalid.
- Forcing the Pattern: Not every consolidation is a flag. Use strict criteria.
Bull Flag vs. Bear Flag
It’s important to distinguish between the bull flag and its bearish counterpart.
| Feature | Bull Flag | Bear Flag |
| Market Trend | Uptrend | Downtrend |
| Consolidation Slope | Downward or sideways | Upward or sideways |
| Breakout Direction | Above resistance | Below support |
| Trading Bias | Long | Short |
Both patterns indicate continuation, but in opposite directions.
Best Markets
While the bull flag works in any trending market, it’s especially effective in:
- Cryptocurrencies: Due to high volatility and momentum.
- Growth Stocks: Tech and momentum-driven stocks often show strong flags.
- Forex Pairs: Especially in trending currencies with economic catalysts.
- Futures and Commodities: Like oil or gold during trend phases.
Scalpers, swing traders, and even position traders use bull flags as part of their technical toolkit.
Final Thoughts
The bull flag pattern is a time-tested technical formation that gives traders a reliable way to join ongoing trends. With clear signals for Entry, exit, and risk management, it’s one of the most favored setups in the stock and crypto trading communities.
Learning to identify a valid bull flag, wait for breakout confirmation, and trade it with discipline can lead to consistent, profitable trades. Like any strategy, success depends on proper execution and managing risk, but when done right, the bull flag can be a game-changer in your trading approach.