Richard Demille Wyckoff, a renowned pioneer in technical analysis during the early 20th century, developed a powerful method to decipher market behavior. The Wyckoff Method focuses on identifying the actions of large, influential market participants, often referred to as “smart money,” as they systematically build or offload their positions. Wyckoff Accumulation believed that market movements are fundamentally driven by the interplay of supply and demand, and understanding how smart money accumulates and distributes holdings offers a crucial advantage in forecasting future price trends. Many professional traders still apply Wyckoff’s principles today, underscoring their enduring relevance in financial markets, including stocks, commodities, bonds, currencies, and cryptocurrencies.
Table of Contents
The Foundational Laws of the Wyckoff Accumulation
The Wyckoff Method operates on three fundamental laws that shape market analysis and trading decisions. These laws offer a framework for understanding price movements and anticipating trend changes.
The Law of Supply and Demand
This core principle dictates price direction. When demand surpasses supply, prices rise; conversely, when supply exceeds demand, prices fall. Traders analyze this balance by comparing price and volume movements over time, observing how buying and selling pressures interact. A simple example involves high volume on wide-range price bars closing near their highs, signaling strong demand. Conversely, high volume on wide-range bars closing near their lows suggests significant supply.
The Law of Cause and Effect
This law helps traders and investors set price objectives by measuring the potential extent of a trend emerging from a trading range. In Wyckoff’s framework, the horizontal point count within a Point-and-Figure (P&F) chart represents the “cause,” while the subsequent price movement out of the trading range signifies the “effect”. The strength of accumulation or distribution within a trading range determines the magnitude of the following price trend. P&F charts are specifically used to measure this cause and project the potential extent of its effect.
The Law of Effort Versus Result
This law provides early warnings of potential trend changes. Divergences between volume (effort) and price (result) often signal a shift in the direction of the rice trend. For instance, if volume increases substantially (considerable effort). Still, the price fails to make new highs or shows only a narrow range (little or no result) after a significant rally, which suggests that large interests are offloading shares, anticipating a trend reversal. Conversely, in an accumulation trading range, increased volume with minimal price advance on a reaction to support indicates that significant interests are absorbing supply, which signals a bullish outlook.
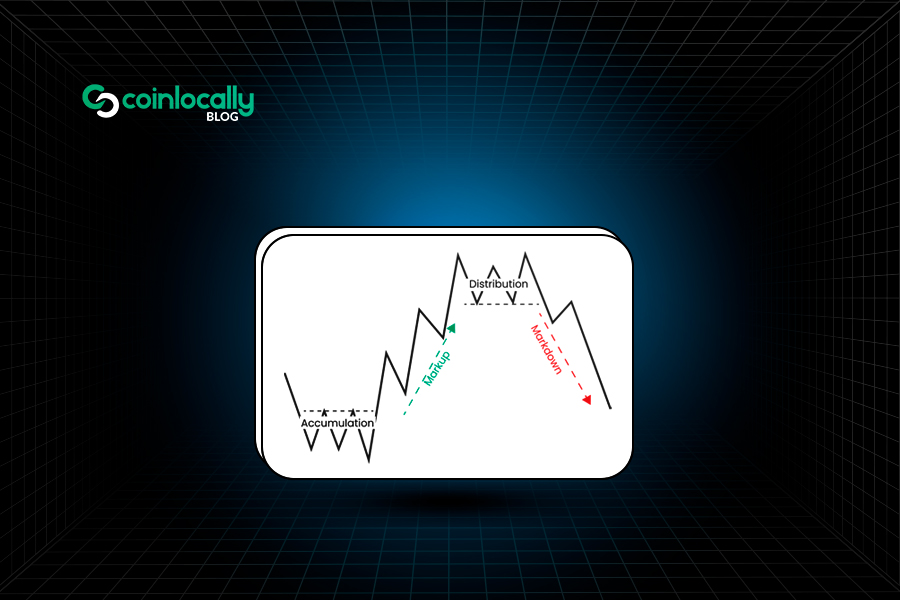
The Wyckoff Accumulation Cycle: Accumulation and Distribution
The Wyckoff market cycle theory explains how and why security prices move in a cyclical pattern of four distinct phases: accumulation, markup, distribution, and markdown. These phases reflect the behavior of market participants and reveal the direction of future price movements.
Wyckoff Accumulation Phase
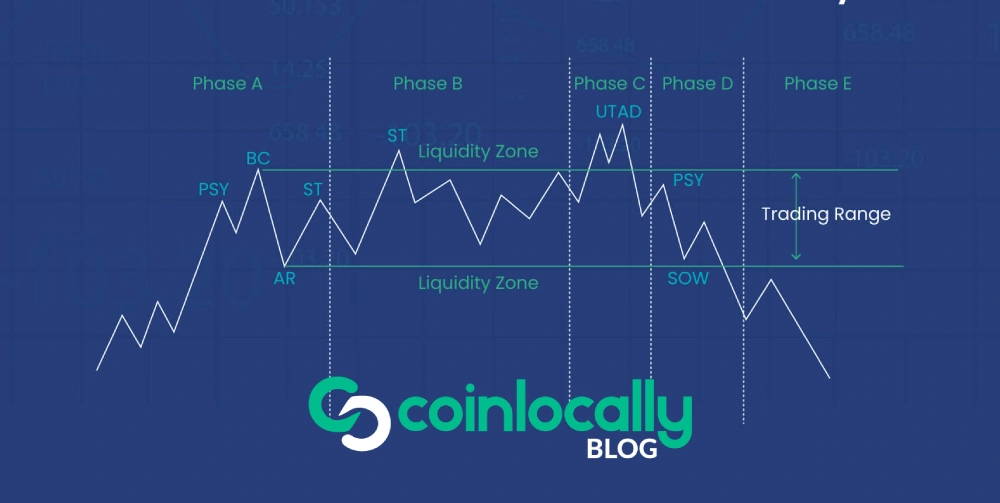
The accumulation phase initiates a new cycle and forms a trading range. During this period, smart money systematically builds positions without causing sharp price increases. Demand gradually lifts prices, allowing traders to draw a support line under the lows. On a chart, this phase shows a series of higher highs and higher closes. Institutional investors absorb selling pressure from weaker market participants, which manifests as decreased volatility, diminishing volume, and higher lows within the range. This process creates a “cause” for a new uptrend.
Key Events in Wyckoff Accumulation:
- Preliminary Support (PS): Substantial buying begins to provide support after a prolonged decline, with increasing volume and widening price spreads.
- Selling Climax (SC): Selling pressure climaxes as the public panics and significant professional interests absorb shares near a bottom. Prices often close well off the low, indicating buying by these essential interests.
- Automatic Rally (AR): A rapid price rebound occurs as intense selling pressure diminishes, fueled by institutional demand and short-covering. The high of this rally establishes the upper boundary of the accumulation trading range.
- Secondary Test (ST): The price revisits the SC area to test supply and demand. For confirmation of a bottom, volume and price spread should significantly decrease as the market approaches support. Multiple STs are common.
- Spring or Shakeout: Often occurring late in the trading range, a spring is a temporary dip below the trading range’s low, quickly reversing back into the range. This action misleads the public, appearing as a resumption of the downtrend, but in reality, it allows significant interests to acquire additional shares at bargain prices. A shakeout is similar, but with more pronounced downward movement, to induce retail traders to sell. Not all accumulation patterns include a spring or shakeout.
- Sign of Strength (SOS): A price advance on an increasing spread and relatively higher volume, often occurring after a spring, validating the prior action.
- Last Point of Support (LPS): The low point of a reaction or pullback after an SOS. This pullback to what was formerly resistance occurs on diminished spread and volume. Multiple LPSs can appear on charts.
- Back-up (BU): A common structural element preceding a substantial markup. It represents a pullback to test the resistance area, which now acts as support, confirming that supply has been absorbed.
Phases of Accumulation (A-E):
- Phase A: Stopping the Downtrend: This phase marks the end of the prior downtrend, characterized by Preliminary Support (PS) and a Selling Climax (SC), followed by an Automatic Rally (AR) and Secondary Test (ST). These events show the transfer of shares from the public to professional interests.
- Phase B: Building the Cause: Institutions accumulate shares within a sideways trading range to “build a cause” for the new uptrend. This lengthy process involves buying at lower prices and checking advances with short sales. Price swings are initially wide with high volume, but volume on downswings diminishes as supply is absorbed.
- Phase C: Testing the Supply: This phase features a decisive test of the remaining supply. A spring is a classic example, where price dips below support and quickly reverses, trapping late sellers. A low-volume spring or test indicates readiness for an upward move. The appearance of an SOS shortly after validates the analysis. Wyckoff Accumulation Schematic 1 typically depicts a spring, while Wyckoff Accumulation Schematic 2 shows a trading range without a spring.
- Phase D: Dominance of Demand: Demand consistently outweighs supply, which is evident in advances (SOSs) with widening price spreads and increasing volume, as well as corrections (LPSs) with smaller spreads and diminished volumes. Price moves at least to the top of the trading range, and LPSs offer excellent opportunities to initiate or add long positions.
- Phase E: The Markup Begins: The asset breaks out of the trading range, and demand takes complete control. Setbacks are usually short-lived. New, higher-level trading ranges (re-accumulation) can form, acting as “stepping stones” towards higher price targets.
Markup Phase
Following successful accumulation, the markup phase begins. This period sees the price break out above the trading range and enter a sustained uptrend. Smart money starts realizing profits on its accumulated positions. Pullbacks to new support levels offer buying opportunities, similar to “buy-the-dip” patterns. Re-accumulation phases, characterized by smaller consolidations, can interrupt the markup. This phase continues as long as new highs are consistently generated.
Distribution Phase
The distribution phase follows a strong uptrend and often foreshadows a significant decline. It mirrors the accumulation scheme in reverse. During distribution, smart money begins selling into strength, usually keeping the price relatively flat to avoid panic among less-informed buyers. This systematic offloading eventually leaves the security in weaker hands.
Key Events in Distribution:
- Preliminary Supply (PSY): Early signs of selling emerge after a pronounced uptrend, with volume spikes on relatively small price changes, suggesting the uptrend is nearing its end.
- Buying Climax (BC): Price surges to a new high on accelerating volume, representing the final effort by smart money to sell into buying enthusiasm from the public. This often coincides with positive news.
- Automatic Reaction (AR): Occurs due to diminished buying demand after the BC and continued heavy supply. The low of this selloff helps define the lower boundary of the distribution trading range.
- Secondary Test (ST): The price revisits the BC area to test the supply/demand balance. Supply should outweigh demand for a top to be confirmed, with decreasing volume and spread as price approaches resistance. An ST may take the form of an upthrust (UT).
- Upthrust (UT): A false breakout above the trading range’s resistance level, creating the illusion of renewed strength but on lighter volume, trapping late buyers. It serves as a test of remaining demand and allows significant interests to mislead the public and sell shares at elevated prices.
- Sign of Weakness (SOW): A downward movement to or past the lower boundary of the trading range, usually with increased spread and volume. This indicates a “change of character” in price action, with supply now dominating.
- Last Point of Supply (LPSY): A weak rally with a narrow price spread after testing support on an SOW, showing the market’s difficulty in advancing. This represents exhaustion of demand and the final waves of distribution before markdown begins.
- Upthrust After Distribution (UTAD): The distributional counterpart to a spring, occurring in the latter stages of the trading range. It provides a definitive test of new demand after a breakout above resistance, but like springs, it is not a required structural element.
Phases of Distribution (A-E):
- Phase A: Stopping the Uptrend: Marks the halt of the prior uptrend. Preliminary Supply (PSY) and the Buying Climax (BC) provide the first significant evidence of supply entering the market, followed by an Automatic Reaction (AR) and a Secondary Test (ST).
- Phase B: Building the Cause: Institutions and significant professional interests systematically dispose of their extended inventory and initiate short positions, building a “cause” for a new downtrend. This process leaves clues that the supply/demand balance has shifted towards supply.
- Phase C: Testing the Demand: This phase may involve an Upthrust (UT) or UTAD, which tests the remaining demand by moving the price above resistance before quickly reversing back into the range. This is a “bull trap” designed to trick uninformed traders into buying before the markdown.
- Phase D: Dominance of Supply: Supply clearly dominates as price moves to or through the trading range’s support. Multiple weak rallies (LPSYs) occur, offering excellent opportunities for initiating or adding short positions.
- Phase E: The Markdown Begins: The asset leaves the trading range, and supply takes complete control. Support is broken on a major SOW, often tested with a rally that fails near the broken support. Subsequent rallies during the markdown are typically feeble.
Markdown Phase
After distribution completes, the markdown phase begins, characterized by a sharp price decline. This bearish period can include redistribution segments, where the trend pauses, attracting new positions that will eventually be sold. Steeper bounces within this structure are referred to as corrections. The markdown phase ends when a broad trading range or base signals the start of a new accumulation phase, completing the cycle.
Practical Application of the Wyckoff Accumulation
Traders use the Wyckoff Method to identify significant trend changes and capitalize on them. This approach involves a systematic five-step process, complemented by various analytical tools.
The Five-Step Market Analysis Process
Wyckoff’s method outlines a five-step approach for selecting securities and timing trades.
- Determine Current and Future Market Trends: Assess whether the market is consolidating or trending, and if supply and demand indicate a probable future direction. This helps decide whether to be in the market and whether to take long or short positions, using bar charts and P&F charts of major market indices.
- Select Securities in Harmony with the Trend: In an uptrend, choose stocks stronger than the market (greater percentage increases during rallies, smaller decreases during reactions). In a downtrend, select weaker stocks. Compare individual stock bar charts with relevant market indices.
- Select Securities with Sufficient “Cause”: Identify stocks under accumulation or re-accumulation (for long positions) that have built enough “cause” to meet or exceed your price objective. This step relies on P&F charts for price projections based on the law of cause and effect.
- Determine Readiness to Move: Apply Wyckoff’s nine tests for buying or selling to confirm if a stock is ready to leave its trading range. This involves examining price and volume behavior and overall market context.
- Time Commitment with Market Turns: Align your trade entry with anticipated turns in the broader market index. Most individual securities move in harmony with the general market, increasing the odds of a successful trade. Use Wyckoff principles like “change of character” in price action and the three laws to anticipate turns. Place stop-loss orders and adjust them as appropriate until closing the position.
The Nine Buying and Selling Tests
These specific principles help pinpoint when a trading range is concluding and a new trend is about to begin. They define the market’s path of least resistance.
Wyckoff Buying Tests for Accumulation:
- The downside price objective was accomplished (P&F chart).
- Preliminary support, selling climax, and secondary test are present (Bar and P&F charts).
- Bullish activity (volume increases on rallies, diminishes during reactions) (Bar chart).
- The downward stride was broken (the supply line/downtrend line was penetrated) (Bar or P&F chart).
- Higher lows (Bar or P&F chart).
- Higher highs (Bar or P&F chart).
- Stock stronger than the market (more responsive to rallies, more resistant to reactions) (Bar chart).
- Base forming (horizontal price line) (Bar or P&F chart).
- The estimated upside profit potential is at least three times the potential loss if the initial stop-loss is hit (P&F and bar charts).
Wyckoff Selling Tests for Distribution:
- Upside objective accomplished (P&F chart).
- Bearish activity (volume decreases on rallies, increases on reactions) (Bar and P&F charts).
- Preliminary supply, buying climax present (Bar and P&F charts).
- Stock weaker than the market (more responsive to reactions, sluggish on rallies) (Bar chart).
- The upward stride was broken (the support line/uptrend line was penetrated) (Bar or P&F chart).
- Lower highs (Bar or P&F chart).
- Lower lows (Bar or P&F chart).
- Crown forming (lateral movement) (P&F chart).
- The estimated downside profit potential is at least three times the risk if the initial stop-loss is hit (P&F and bar charts).
The Composite Man
Wyckoff introduced the concept of the “Composite Man” as a heuristic device to help traders understand overall market movements. This theoretical entity represents the collective actions of large, professional operators who manipulate prices. Wyckoff advised retail traders to study market fluctuations as if they were the result of a single operator’s actions, emphasizing that understanding the Composite Man’s game can lead to significant profit. The Composite Man carefully plans and executes campaigns, attracting public buying to offload accumulated shares by creating the appearance of a “broad market” through numerous transactions with large volumes. By interpreting chart patterns, traders can discern the motives of these dominant operators.
Chart Analysis Methods
Wyckoff’s method heavily relies on analyzing price and volume behavior on charts.
- Volume Signals: Volume analysis is crucial for confirming Wyckoff patterns. In accumulation, expect high volume spikes at initial support, a gradual decline during consolidation, sharp increases during a spring/shakeout, and strong growth upon breakout. In distribution, volume tends to increase during the trading range and spikes heavily during markdown.
- Price Movement Patterns: Look for sideways price action within a defined range, progressively higher lows during accumulation, and lower highs during distribution. Smaller candles and narrowing price ranges suggest consolidation, while quick rebounds from support indicate buying interest. Conversely, larger candle bodies and increased volatility suggest distribution.
- Time Frame Selection: Longer time frames, such as 12-hour charts or higher, are often more effective for identifying institutional activity and full Wyckoff patterns. Traders usually combine multiple time frames, starting with weekly charts for a broader context and then zooming into daily or 12-hour charts for precise entry and exit points.
Trading Strategies and Risk Management
Incorporating the Wyckoff Method into trading requires a systematic approach and sound risk management.
- Confirmation and Entry Strategies: Confirm the Wyckoff pattern with additional technical indicators like moving averages or trend lines before entering trades. For accumulation, a common strategy involves waiting for a breakout above resistance with increased volume. For distribution, wait for a breakdown confirmation or a retest of resistance.
- Position Sizing and Stop-Loss Placement: Determine position size based on risk tolerance and account size. Place stop-loss orders below key support levels for long positions or above key resistance levels for short positions to limit potential losses.
- Profit-Taking Strategies: Set profit targets based on resistance levels, Fibonacci extensions, or projected price targets derived from the Wyckoff pattern. Consider partial profit-taking to secure gains while allowing for further appreciation.
- Monitoring and Adjusting: Continuously monitor positions and adjust strategies as market conditions evolve. Analyze volume, price action, and overall market structure to identify signs of weakening or strengthening trends. Trailing stop-loss orders can help lock in profits.
- Combining with Other Analysis Techniques: The Wyckoff Method gains strength when combined with other tools like candlestick patterns, trend analysis, or momentum indicators, providing additional confirmation and improving decision accuracy.
Conclusion on Wyckoff Accumulation
Richard Wyckoff’s work gives key insights into market reversals and breakouts. His focus on accumulation and distribution patterns is instrumental. Studying volume, price action, and market structure can improve trading decisions.
A disciplined approach—using confirmation strategies, risk management, and regular monitoring—helps traders follow “smart money.” Wyckoff analysis takes practice, but its logical structure provides a strong system. It helps identify high-probability, profitable trades and is valuable for serious traders.